Lactococcus phage CHPC148
Taxonomy: Viruses; Duplodnaviria; Heunggongvirae; Uroviricota; Caudoviricetes; Caudovirales; Siphoviridae; unclassified Siphoviridae
Average proteome isoelectric point is 6.7
Get precalculated fractions of proteins
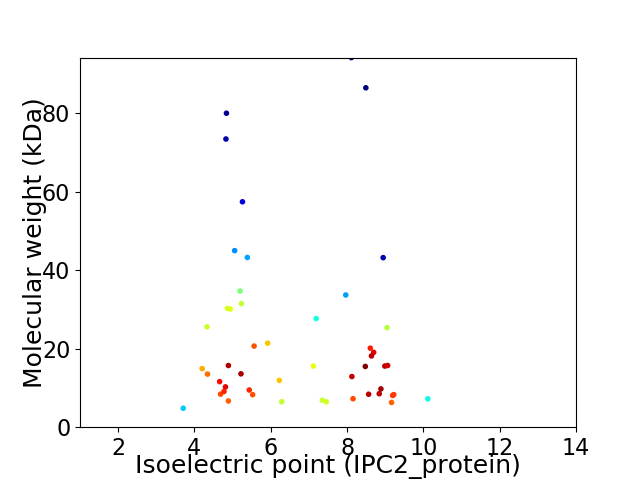
Virtual 2D-PAGE plot for 50 proteins (isoelectric point calculated using IPC2_protein)
Get csv file with sequences according to given criteria:
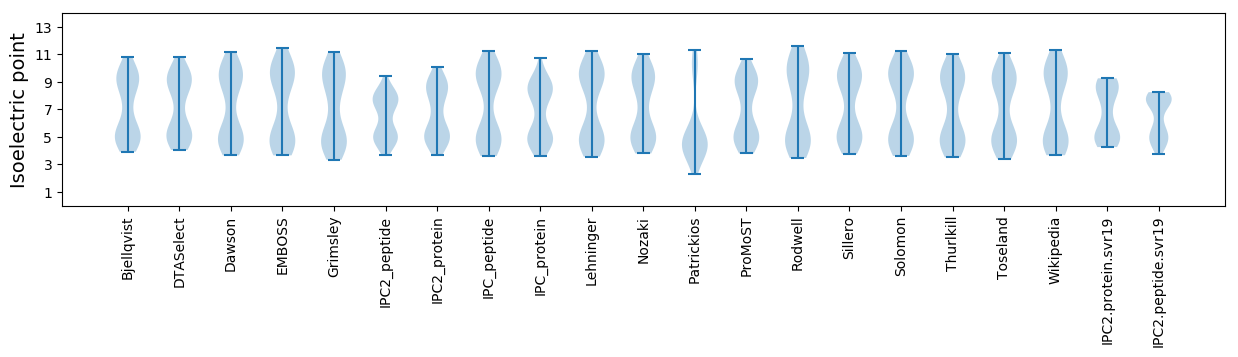
* You can choose from 21 different methods for calculating isoelectric point
Summary statistics related to proteome-wise predictions
Protein with the lowest isoelectric point:
>tr|A0A650F7K8|A0A650F7K8_9CAUD Capsid and scaffold protein OS=Lactococcus phage CHPC148 OX=2675248 GN=CHPC148_000530 PE=4 SV=1
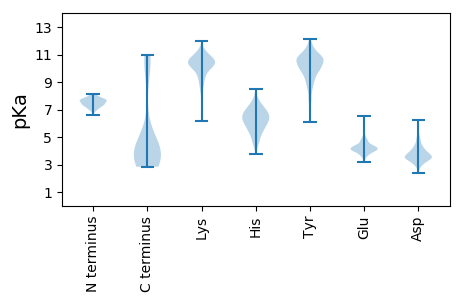
MM1 pKa = 7.36SVTVDD6 pKa = 4.12DD7 pKa = 6.04LLDD10 pKa = 3.62QLSEE14 pKa = 4.54DD15 pKa = 5.09DD16 pKa = 4.43DD17 pKa = 4.84RR18 pKa = 11.84KK19 pKa = 10.14PQLQIYY25 pKa = 9.45FDD27 pKa = 3.58TATAYY32 pKa = 10.31VKK34 pKa = 10.74NAVSSDD40 pKa = 3.41TVEE43 pKa = 3.66
MM1 pKa = 7.36SVTVDD6 pKa = 4.12DD7 pKa = 6.04LLDD10 pKa = 3.62QLSEE14 pKa = 4.54DD15 pKa = 5.09DD16 pKa = 4.43DD17 pKa = 4.84RR18 pKa = 11.84KK19 pKa = 10.14PQLQIYY25 pKa = 9.45FDD27 pKa = 3.58TATAYY32 pKa = 10.31VKK34 pKa = 10.74NAVSSDD40 pKa = 3.41TVEE43 pKa = 3.66
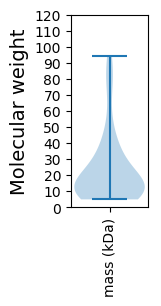
Molecular weight: 4.84 kDa
Isoelectric point according different methods:
Protein with the highest isoelectric point:
>tr|A0A650ESM8|A0A650ESM8_9CAUD Uncharacterized protein OS=Lactococcus phage CHPC148 OX=2675248 GN=CHPC148_000551 PE=4 SV=1
MM1 pKa = 7.61SKK3 pKa = 10.23LQSSLILSSRR13 pKa = 11.84IRR15 pKa = 11.84NNSTLAKK22 pKa = 9.47PPWAVVSYY30 pKa = 9.93LVKK33 pKa = 10.87AGGWRR38 pKa = 11.84NDD40 pKa = 3.57RR41 pKa = 11.84KK42 pKa = 8.94VHH44 pKa = 6.0EE45 pKa = 4.51YY46 pKa = 10.4SVPAHH51 pKa = 6.12KK52 pKa = 10.21HH53 pKa = 4.43SLPAFNLKK61 pKa = 10.4NKK63 pKa = 7.63TT64 pKa = 3.46
MM1 pKa = 7.61SKK3 pKa = 10.23LQSSLILSSRR13 pKa = 11.84IRR15 pKa = 11.84NNSTLAKK22 pKa = 9.47PPWAVVSYY30 pKa = 9.93LVKK33 pKa = 10.87AGGWRR38 pKa = 11.84NDD40 pKa = 3.57RR41 pKa = 11.84KK42 pKa = 8.94VHH44 pKa = 6.0EE45 pKa = 4.51YY46 pKa = 10.4SVPAHH51 pKa = 6.12KK52 pKa = 10.21HH53 pKa = 4.43SLPAFNLKK61 pKa = 10.4NKK63 pKa = 7.63TT64 pKa = 3.46
Molecular weight: 7.23 kDa
Isoelectric point according different methods:
Peptides (in silico digests for buttom-up proteomics)
Below you can find in silico digests of the whole proteome with Trypsin, Chymotrypsin, Trypsin+LysC, LysN, ArgC proteases suitable for different mass spec machines.| Try ESI |
 |
|---|
| ChTry ESI |
|
|---|
| ArgC ESI |
|
|---|
| LysN ESI |
|
|---|
| TryLysC ESI |
|
|---|
| Try MALDI |
|
|---|
| ChTry MALDI |
|
|---|
| ArgC MALDI |
|
|---|
| LysN MALDI |
|
|---|
| TryLysC MALDI |
|
|---|
| Try LTQ |
|
|---|
| ChTry LTQ |
|
|---|
| ArgC LTQ |
|
|---|
| LysN LTQ |
|
|---|
| TryLysC LTQ |
|
|---|
| Try MSlow |
|
|---|
| ChTry MSlow |
|
|---|
| ArgC MSlow |
|
|---|
| LysN MSlow |
|
|---|
| TryLysC MSlow |
|
|---|
| Try MShigh |
|
|---|
| ChTry MShigh |
|
|---|
| ArgC MShigh |
|
|---|
| LysN MShigh |
|
|---|
| TryLysC MShigh |
|
|---|
General Statistics
Number of major isoforms |
Number of additional isoforms |
Number of all proteins |
Number of amino acids |
Min. Seq. Length |
Max. Seq. Length |
Avg. Seq. Length |
Avg. Mol. Weight |
|---|---|---|---|---|---|---|---|
0 |
10277 |
43 |
897 |
205.5 |
23.18 |
Amino acid frequency
Ala |
Cys |
Asp |
Glu |
Phe |
Gly |
His |
Ile |
Lys |
Leu |
|---|---|---|---|---|---|---|---|---|---|
6.617 ± 0.706 | 0.555 ± 0.124 |
6.383 ± 0.325 | 6.782 ± 0.43 |
3.98 ± 0.27 | 6.568 ± 0.493 |
1.362 ± 0.174 | 6.86 ± 0.322 |
9.088 ± 0.491 | 7.843 ± 0.31 |
Met |
Asn |
Gln |
Pro |
Arg |
Ser |
Thr |
Val |
Trp |
Tyr |
|---|---|---|---|---|---|---|---|---|---|
2.793 ± 0.194 | 6.364 ± 0.269 |
2.53 ± 0.291 | 4.661 ± 0.309 |
3.62 ± 0.383 | 7.035 ± 0.323 |
6.159 ± 0.516 | 5.858 ± 0.304 |
1.314 ± 0.156 | 3.629 ± 0.214 |
Most of the basic statistics you can see at this page can be downloaded from this CSV file
See this proteome in:

Proteome-pI is available under Creative Commons Attribution-NoDerivs license, for more details see here
| Reference: Kozlowski LP. Proteome-pI 2.0: Proteome Isoelectric Point Database Update. Nucleic Acids Res. 2021, doi: 10.1093/nar/gkab944 | Contact: Lukasz P. Kozlowski |