Muribacter muris
Taxonomy: cellular organisms;
Average proteome isoelectric point is 6.66
Get precalculated fractions of proteins
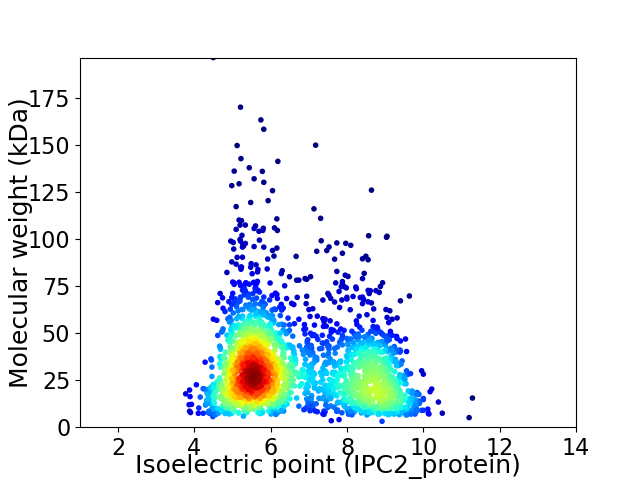
Virtual 2D-PAGE plot for 2190 proteins (isoelectric point calculated using IPC2_protein)
Get csv file with sequences according to given criteria:
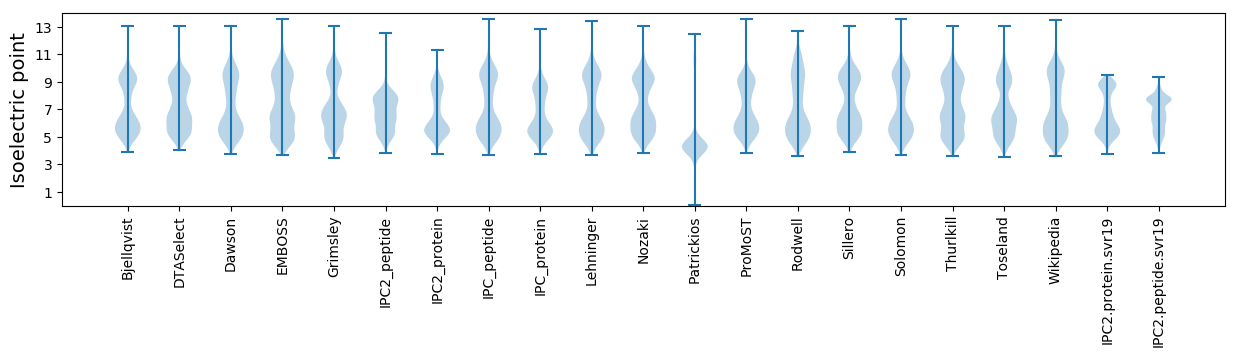
* You can choose from 21 different methods for calculating isoelectric point
Summary statistics related to proteome-wise predictions
Protein with the lowest isoelectric point:
>tr|A0A0J5S163|A0A0J5S163_9PAST Uncharacterized protein OS=Muribacter muris OX=67855 GN=RO21_10775 PE=4 SV=1
MM1 pKa = 8.32SEE3 pKa = 4.11MNIPLIFTDD12 pKa = 3.81AAANKK17 pKa = 9.16VKK19 pKa = 10.76SLIEE23 pKa = 4.5GEE25 pKa = 4.46DD26 pKa = 3.6NPNLRR31 pKa = 11.84LRR33 pKa = 11.84VYY35 pKa = 9.12ITGGGCSGFQYY46 pKa = 11.03GFTFDD51 pKa = 4.83DD52 pKa = 3.68QVNDD56 pKa = 3.5GDD58 pKa = 4.74LTIEE62 pKa = 4.06NQNVGLVVDD71 pKa = 4.64PMSLQYY77 pKa = 11.06LIGGTVDD84 pKa = 3.54YY85 pKa = 11.18IEE87 pKa = 4.62GLEE90 pKa = 4.0GSRR93 pKa = 11.84FIVNNPNASSTCGCGSSFSII113 pKa = 5.02
MM1 pKa = 8.32SEE3 pKa = 4.11MNIPLIFTDD12 pKa = 3.81AAANKK17 pKa = 9.16VKK19 pKa = 10.76SLIEE23 pKa = 4.5GEE25 pKa = 4.46DD26 pKa = 3.6NPNLRR31 pKa = 11.84LRR33 pKa = 11.84VYY35 pKa = 9.12ITGGGCSGFQYY46 pKa = 11.03GFTFDD51 pKa = 4.83DD52 pKa = 3.68QVNDD56 pKa = 3.5GDD58 pKa = 4.74LTIEE62 pKa = 4.06NQNVGLVVDD71 pKa = 4.64PMSLQYY77 pKa = 11.06LIGGTVDD84 pKa = 3.54YY85 pKa = 11.18IEE87 pKa = 4.62GLEE90 pKa = 4.0GSRR93 pKa = 11.84FIVNNPNASSTCGCGSSFSII113 pKa = 5.02
Molecular weight: 12.11 kDa
Isoelectric point according different methods:
Protein with the highest isoelectric point:
>tr|A0A0J5P9H0|A0A0J5P9H0_9PAST Ferrous iron transporter OS=Muribacter muris OX=67855 GN=fieF PE=4 SV=1
MM1 pKa = 7.71LLLKK5 pKa = 10.54LQIRR9 pKa = 11.84PLLQTVRR16 pKa = 11.84QKK18 pKa = 10.7PQAHH22 pKa = 5.94RR23 pKa = 11.84QMQRR27 pKa = 11.84TAPQLKK33 pKa = 9.26PIHH36 pKa = 5.91LQPPQVLQQLPHH48 pKa = 4.65QTQRR52 pKa = 11.84PLQTVRR58 pKa = 11.84QQRR61 pKa = 11.84QVPPQVQQTALQIKK75 pKa = 9.63PILQQLPHH83 pKa = 6.5QIQHH87 pKa = 7.13LLQIVRR93 pKa = 11.84QQRR96 pKa = 11.84QVPLQVQRR104 pKa = 11.84IALQLKK110 pKa = 9.53RR111 pKa = 11.84VLPQLPHH118 pKa = 5.96QIQRR122 pKa = 11.84LLQIVQQKK130 pKa = 9.76
MM1 pKa = 7.71LLLKK5 pKa = 10.54LQIRR9 pKa = 11.84PLLQTVRR16 pKa = 11.84QKK18 pKa = 10.7PQAHH22 pKa = 5.94RR23 pKa = 11.84QMQRR27 pKa = 11.84TAPQLKK33 pKa = 9.26PIHH36 pKa = 5.91LQPPQVLQQLPHH48 pKa = 4.65QTQRR52 pKa = 11.84PLQTVRR58 pKa = 11.84QQRR61 pKa = 11.84QVPPQVQQTALQIKK75 pKa = 9.63PILQQLPHH83 pKa = 6.5QIQHH87 pKa = 7.13LLQIVRR93 pKa = 11.84QQRR96 pKa = 11.84QVPLQVQRR104 pKa = 11.84IALQLKK110 pKa = 9.53RR111 pKa = 11.84VLPQLPHH118 pKa = 5.96QIQRR122 pKa = 11.84LLQIVQQKK130 pKa = 9.76
Molecular weight: 15.47 kDa
Isoelectric point according different methods:
Peptides (in silico digests for buttom-up proteomics)
Below you can find in silico digests of the whole proteome with Trypsin, Chymotrypsin, Trypsin+LysC, LysN, ArgC proteases suitable for different mass spec machines.| Try ESI |
 |
|---|
| ChTry ESI |
|
|---|
| ArgC ESI |
|
|---|
| LysN ESI |
|
|---|
| TryLysC ESI |
|
|---|
| Try MALDI |
|
|---|
| ChTry MALDI |
|
|---|
| ArgC MALDI |
|
|---|
| LysN MALDI |
|
|---|
| TryLysC MALDI |
|
|---|
| Try LTQ |
|
|---|
| ChTry LTQ |
|
|---|
| ArgC LTQ |
|
|---|
| LysN LTQ |
|
|---|
| TryLysC LTQ |
|
|---|
| Try MSlow |
|
|---|
| ChTry MSlow |
|
|---|
| ArgC MSlow |
|
|---|
| LysN MSlow |
|
|---|
| TryLysC MSlow |
|
|---|
| Try MShigh |
|
|---|
| ChTry MShigh |
|
|---|
| ArgC MShigh |
|
|---|
| LysN MShigh |
|
|---|
| TryLysC MShigh |
|
|---|
General Statistics
Number of major isoforms |
Number of additional isoforms |
Number of all proteins |
Number of amino acids |
Min. Seq. Length |
Max. Seq. Length |
Avg. Seq. Length |
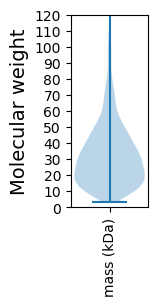
Avg. Mol. Weight |
|---|---|---|---|---|---|---|---|
0 |
667018 |
25 |
1807 |
304.6 |
33.99 |
Amino acid frequency
Ala |
Cys |
Asp |
Glu |
Phe |
Gly |
His |
Ile |
Lys |
Leu |
|---|---|---|---|---|---|---|---|---|---|
9.134 ± 0.062 | 1.029 ± 0.016 |
4.976 ± 0.035 | 6.01 ± 0.054 |
4.415 ± 0.044 | 6.696 ± 0.052 |
2.232 ± 0.023 | 6.882 ± 0.051 |
5.741 ± 0.05 | 10.778 ± 0.065 |
Met |
Asn |
Gln |
Pro |
Arg |
Ser |
Thr |
Val |
Trp |
Tyr |
|---|---|---|---|---|---|---|---|---|---|
2.359 ± 0.026 | 4.414 ± 0.04 |
3.938 ± 0.03 | 5.137 ± 0.047 |
4.702 ± 0.047 | 5.56 ± 0.04 |
5.127 ± 0.037 | 6.471 ± 0.046 |
1.194 ± 0.019 | 3.205 ± 0.033 |
Most of the basic statistics you can see at this page can be downloaded from this CSV file
See this proteome in:

Proteome-pI is available under Creative Commons Attribution-NoDerivs license, for more details see here
| Reference: Kozlowski LP. Proteome-pI 2.0: Proteome Isoelectric Point Database Update. Nucleic Acids Res. 2021, doi: 10.1093/nar/gkab944 | Contact: Lukasz P. Kozlowski |