Bos taurus papillomavirus 13
Taxonomy: Viruses; Monodnaviria; Shotokuvirae; Cossaviricota; Papovaviricetes; Zurhausenvirales; Papillomaviridae; Firstpapillomavirinae; Deltapapillomavirus; Deltapapillomavirus 4
Average proteome isoelectric point is 6.69
Get precalculated fractions of proteins
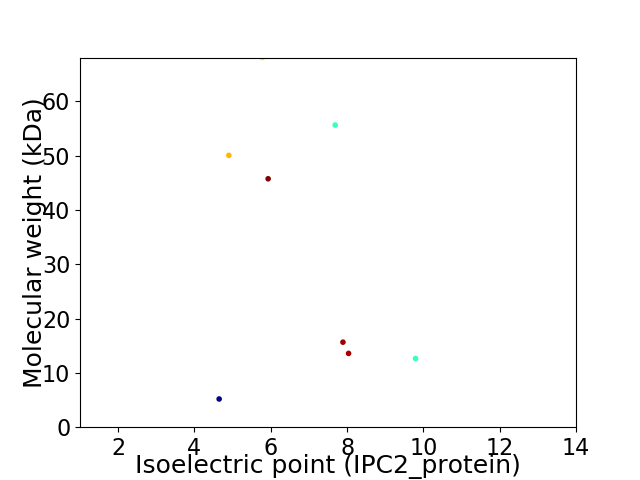
Virtual 2D-PAGE plot for 8 proteins (isoelectric point calculated using IPC2_protein)
Get csv file with sequences according to given criteria:
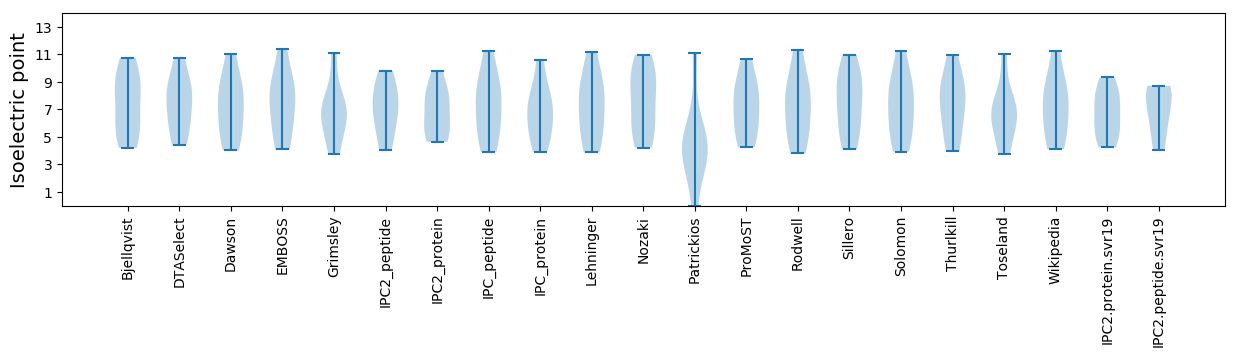
* You can choose from 21 different methods for calculating isoelectric point
Summary statistics related to proteome-wise predictions
Protein with the lowest isoelectric point:
>tr|J9V4T2|J9V4T2_BPV1 Protein E6 OS=Bos taurus papillomavirus 13 OX=1887213 GN=E6 PE=3 SV=1
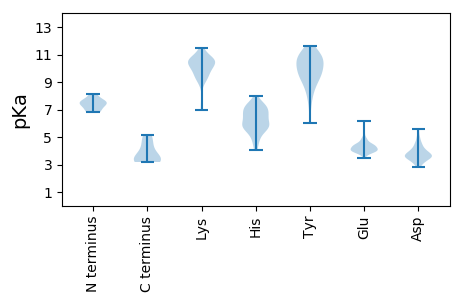
MM1 pKa = 7.49PNLWFLLFLGLVAAMQLLLLLFLLLFFLVYY31 pKa = 9.32WDD33 pKa = 5.61HH34 pKa = 7.17FDD36 pKa = 4.07CSCTGLPFF44 pKa = 4.63
MM1 pKa = 7.49PNLWFLLFLGLVAAMQLLLLLFLLLFFLVYY31 pKa = 9.32WDD33 pKa = 5.61HH34 pKa = 7.17FDD36 pKa = 4.07CSCTGLPFF44 pKa = 4.63
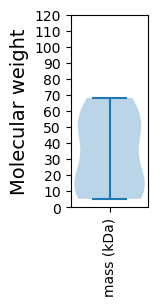
Molecular weight: 5.2 kDa
Isoelectric point according different methods:
Protein with the highest isoelectric point:
>tr|J9V8D6|J9V8D6_BPV1 Protein E7 OS=Bos taurus papillomavirus 13 OX=1887213 GN=E7 PE=3 SV=1
MM1 pKa = 7.21LVSHH5 pKa = 7.33PPLLILEE12 pKa = 4.73IAQTEE17 pKa = 4.58SGSHH21 pKa = 4.82QKK23 pKa = 10.32DD24 pKa = 3.33LKK26 pKa = 10.22EE27 pKa = 3.93TLQEE31 pKa = 4.37KK32 pKa = 10.44KK33 pKa = 10.02PSQPSLSLLCSAPPPAVPSEE53 pKa = 4.08QASVGYY59 pKa = 8.37GTVLARR65 pKa = 11.84TPTIFLQARR74 pKa = 11.84GALFSALPPPRR85 pKa = 11.84CRR87 pKa = 11.84ARR89 pKa = 11.84YY90 pKa = 8.6RR91 pKa = 11.84WTWHH95 pKa = 4.93QGRR98 pKa = 11.84KK99 pKa = 8.84KK100 pKa = 10.52KK101 pKa = 8.97KK102 pKa = 7.05TNRR105 pKa = 11.84PTPQRR110 pKa = 11.84RR111 pKa = 11.84NLL113 pKa = 3.44
MM1 pKa = 7.21LVSHH5 pKa = 7.33PPLLILEE12 pKa = 4.73IAQTEE17 pKa = 4.58SGSHH21 pKa = 4.82QKK23 pKa = 10.32DD24 pKa = 3.33LKK26 pKa = 10.22EE27 pKa = 3.93TLQEE31 pKa = 4.37KK32 pKa = 10.44KK33 pKa = 10.02PSQPSLSLLCSAPPPAVPSEE53 pKa = 4.08QASVGYY59 pKa = 8.37GTVLARR65 pKa = 11.84TPTIFLQARR74 pKa = 11.84GALFSALPPPRR85 pKa = 11.84CRR87 pKa = 11.84ARR89 pKa = 11.84YY90 pKa = 8.6RR91 pKa = 11.84WTWHH95 pKa = 4.93QGRR98 pKa = 11.84KK99 pKa = 8.84KK100 pKa = 10.52KK101 pKa = 8.97KK102 pKa = 7.05TNRR105 pKa = 11.84PTPQRR110 pKa = 11.84RR111 pKa = 11.84NLL113 pKa = 3.44
Molecular weight: 12.65 kDa
Isoelectric point according different methods:
Peptides (in silico digests for buttom-up proteomics)
Below you can find in silico digests of the whole proteome with Trypsin, Chymotrypsin, Trypsin+LysC, LysN, ArgC proteases suitable for different mass spec machines.| Try ESI |
 |
|---|
| ChTry ESI |
|
|---|
| ArgC ESI |
|
|---|
| LysN ESI |
|
|---|
| TryLysC ESI |
|
|---|
| Try MALDI |
|
|---|
| ChTry MALDI |
|
|---|
| ArgC MALDI |
|
|---|
| LysN MALDI |
|
|---|
| TryLysC MALDI |
|
|---|
| Try LTQ |
|
|---|
| ChTry LTQ |
|
|---|
| ArgC LTQ |
|
|---|
| LysN LTQ |
|
|---|
| TryLysC LTQ |
|
|---|
| Try MSlow |
|
|---|
| ChTry MSlow |
|
|---|
| ArgC MSlow |
|
|---|
| LysN MSlow |
|
|---|
| TryLysC MSlow |
|
|---|
| Try MShigh |
|
|---|
| ChTry MShigh |
|
|---|
| ArgC MShigh |
|
|---|
| LysN MShigh |
|
|---|
| TryLysC MShigh |
|
|---|
General Statistics
Number of major isoforms |
Number of additional isoforms |
Number of all proteins |
Number of amino acids |
Min. Seq. Length |
Max. Seq. Length |
Avg. Seq. Length |
Avg. Mol. Weight |
|---|---|---|---|---|---|---|---|
0 |
2406 |
44 |
606 |
300.8 |
33.33 |
Amino acid frequency
Ala |
Cys |
Asp |
Glu |
Phe |
Gly |
His |
Ile |
Lys |
Leu |
|---|---|---|---|---|---|---|---|---|---|
7.855 ± 0.55 | 2.494 ± 0.635 |
5.278 ± 0.377 | 5.985 ± 0.535 |
4.073 ± 0.557 | 7.481 ± 0.787 |
2.411 ± 0.182 | 3.699 ± 0.718 |
5.362 ± 0.84 | 9.767 ± 0.889 |
Met |
Asn |
Gln |
Pro |
Arg |
Ser |
Thr |
Val |
Trp |
Tyr |
|---|---|---|---|---|---|---|---|---|---|
1.33 ± 0.22 | 3.533 ± 0.53 |
6.151 ± 1.109 | 4.115 ± 0.471 |
5.943 ± 0.537 | 7.689 ± 0.611 |
6.65 ± 0.554 | 5.569 ± 0.334 |
1.496 ± 0.242 | 3.117 ± 0.271 |
Most of the basic statistics you can see at this page can be downloaded from this CSV file
See this proteome in:

Proteome-pI is available under Creative Commons Attribution-NoDerivs license, for more details see here
| Reference: Kozlowski LP. Proteome-pI 2.0: Proteome Isoelectric Point Database Update. Nucleic Acids Res. 2021, doi: 10.1093/nar/gkab944 | Contact: Lukasz P. Kozlowski |