Smithella sp. SCADC
Taxonomy: cellular organisms; Bacteria; Proteobacteria; delta/epsilon subdivisions; Deltaproteobacteria; Syntrophobacterales; Syntrophaceae; Smithella; unclassified Smithella
Average proteome isoelectric point is 7.17
Get precalculated fractions of proteins
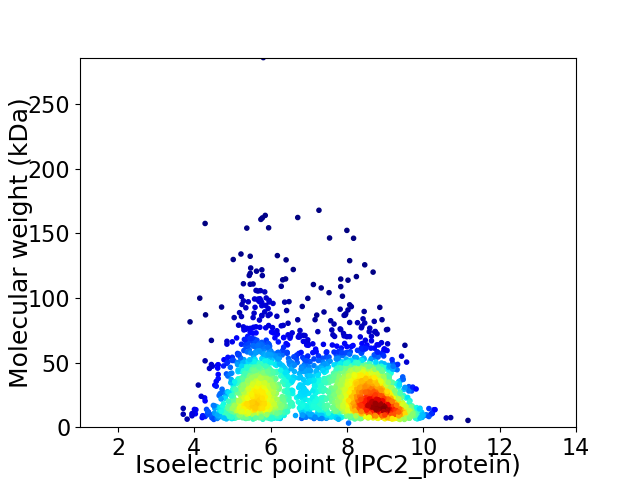
Virtual 2D-PAGE plot for 2552 proteins (isoelectric point calculated using IPC2_protein)
Get csv file with sequences according to given criteria:
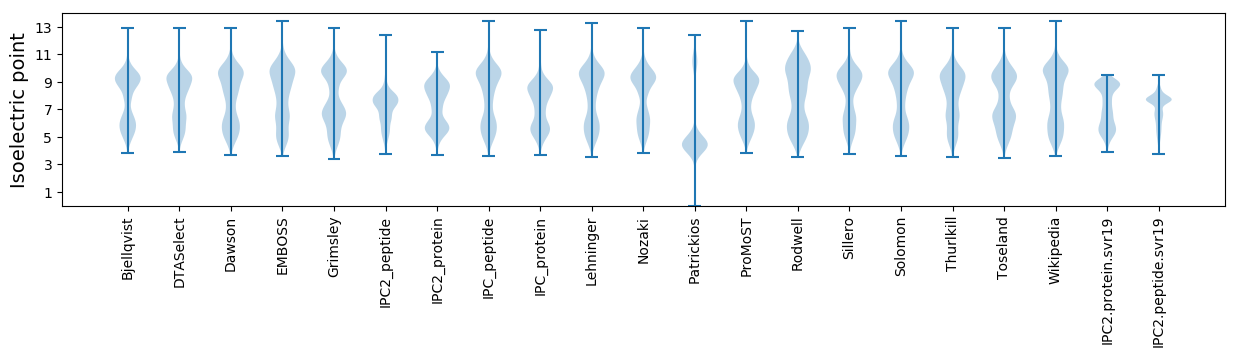
* You can choose from 21 different methods for calculating isoelectric point
Summary statistics related to proteome-wise predictions
Protein with the lowest isoelectric point:
>tr|A0A091F918|A0A091F918_9DELT Branched-chain amino acid ABC transporter ATP-binding protein OS=Smithella sp. SCADC OX=1499107 GN=ER57_15625 PE=4 SV=1
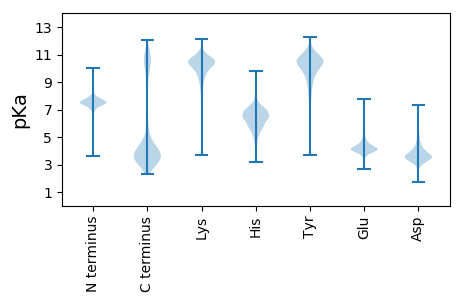
MM1 pKa = 7.73AYY3 pKa = 10.36VITDD7 pKa = 3.16EE8 pKa = 5.53CIACGSCEE16 pKa = 4.16SEE18 pKa = 4.74CPAEE22 pKa = 4.78AISEE26 pKa = 4.31GEE28 pKa = 4.06DD29 pKa = 3.78KK30 pKa = 11.34YY31 pKa = 11.81VIDD34 pKa = 5.8AKK36 pKa = 10.95LCNDD40 pKa = 4.21CGTCVEE46 pKa = 4.28QCPVEE51 pKa = 4.66AIVPGDD57 pKa = 3.5NKK59 pKa = 11.1
MM1 pKa = 7.73AYY3 pKa = 10.36VITDD7 pKa = 3.16EE8 pKa = 5.53CIACGSCEE16 pKa = 4.16SEE18 pKa = 4.74CPAEE22 pKa = 4.78AISEE26 pKa = 4.31GEE28 pKa = 4.06DD29 pKa = 3.78KK30 pKa = 11.34YY31 pKa = 11.81VIDD34 pKa = 5.8AKK36 pKa = 10.95LCNDD40 pKa = 4.21CGTCVEE46 pKa = 4.28QCPVEE51 pKa = 4.66AIVPGDD57 pKa = 3.5NKK59 pKa = 11.1
Molecular weight: 6.23 kDa
Isoelectric point according different methods:
Protein with the highest isoelectric point:
>tr|A0A091FAZ4|A0A091FAZ4_9DELT Uncharacterized protein OS=Smithella sp. SCADC OX=1499107 GN=ER57_10530 PE=4 SV=1
MM1 pKa = 7.73KK2 pKa = 9.08KK3 pKa = 8.39TLTNKK8 pKa = 9.44TNTKK12 pKa = 9.93RR13 pKa = 11.84KK14 pKa = 7.28RR15 pKa = 11.84THH17 pKa = 5.85GFLVRR22 pKa = 11.84MASKK26 pKa = 10.38SGRR29 pKa = 11.84QVLSRR34 pKa = 11.84RR35 pKa = 11.84RR36 pKa = 11.84AKK38 pKa = 9.94GRR40 pKa = 11.84KK41 pKa = 8.66RR42 pKa = 11.84LAVV45 pKa = 3.41
MM1 pKa = 7.73KK2 pKa = 9.08KK3 pKa = 8.39TLTNKK8 pKa = 9.44TNTKK12 pKa = 9.93RR13 pKa = 11.84KK14 pKa = 7.28RR15 pKa = 11.84THH17 pKa = 5.85GFLVRR22 pKa = 11.84MASKK26 pKa = 10.38SGRR29 pKa = 11.84QVLSRR34 pKa = 11.84RR35 pKa = 11.84RR36 pKa = 11.84AKK38 pKa = 9.94GRR40 pKa = 11.84KK41 pKa = 8.66RR42 pKa = 11.84LAVV45 pKa = 3.41
Molecular weight: 5.25 kDa
Isoelectric point according different methods:
Peptides (in silico digests for buttom-up proteomics)
Below you can find in silico digests of the whole proteome with Trypsin, Chymotrypsin, Trypsin+LysC, LysN, ArgC proteases suitable for different mass spec machines.| Try ESI |
 |
|---|
| ChTry ESI |
|
|---|
| ArgC ESI |
|
|---|
| LysN ESI |
|
|---|
| TryLysC ESI |
|
|---|
| Try MALDI |
|
|---|
| ChTry MALDI |
|
|---|
| ArgC MALDI |
|
|---|
| LysN MALDI |
|
|---|
| TryLysC MALDI |
|
|---|
| Try LTQ |
|
|---|
| ChTry LTQ |
|
|---|
| ArgC LTQ |
|
|---|
| LysN LTQ |
|
|---|
| TryLysC LTQ |
|
|---|
| Try MSlow |
|
|---|
| ChTry MSlow |
|
|---|
| ArgC MSlow |
|
|---|
| LysN MSlow |
|
|---|
| TryLysC MSlow |
|
|---|
| Try MShigh |
|
|---|
| ChTry MShigh |
|
|---|
| ArgC MShigh |
|
|---|
| LysN MShigh |
|
|---|
| TryLysC MShigh |
|
|---|
General Statistics
Number of major isoforms |
Number of additional isoforms |
Number of all proteins |
Number of amino acids |
Min. Seq. Length |
Max. Seq. Length |
Avg. Seq. Length |
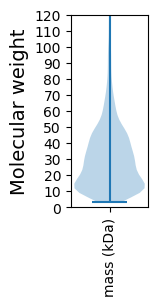
Avg. Mol. Weight |
|---|---|---|---|---|---|---|---|
0 |
732155 |
28 |
2539 |
286.9 |
32.13 |
Amino acid frequency
Ala |
Cys |
Asp |
Glu |
Phe |
Gly |
His |
Ile |
Lys |
Leu |
|---|---|---|---|---|---|---|---|---|---|
7.791 ± 0.046 | 1.24 ± 0.021 |
5.347 ± 0.031 | 6.417 ± 0.046 |
4.492 ± 0.037 | 6.952 ± 0.045 |
1.871 ± 0.023 | 8.099 ± 0.052 |
7.507 ± 0.051 | 9.44 ± 0.053 |
Met |
Asn |
Gln |
Pro |
Arg |
Ser |
Thr |
Val |
Trp |
Tyr |
|---|---|---|---|---|---|---|---|---|---|
2.692 ± 0.025 | 4.362 ± 0.035 |
3.962 ± 0.029 | 3.186 ± 0.03 |
4.887 ± 0.036 | 5.901 ± 0.037 |
5.037 ± 0.038 | 6.459 ± 0.04 |
1.029 ± 0.019 | 3.327 ± 0.029 |
Most of the basic statistics you can see at this page can be downloaded from this CSV file
See this proteome in:

Proteome-pI is available under Creative Commons Attribution-NoDerivs license, for more details see here
| Reference: Kozlowski LP. Proteome-pI 2.0: Proteome Isoelectric Point Database Update. Nucleic Acids Res. 2021, doi: 10.1093/nar/gkab944 | Contact: Lukasz P. Kozlowski |