Salmonella phage vB_SenM-S16
Taxonomy: Viruses; Duplodnaviria; Heunggongvirae; Uroviricota; Caudoviricetes; Caudovirales; Myoviridae; Tevenvirinae; Gelderlandvirus; Salmonella virus S16
Average proteome isoelectric point is 6.33
Get precalculated fractions of proteins
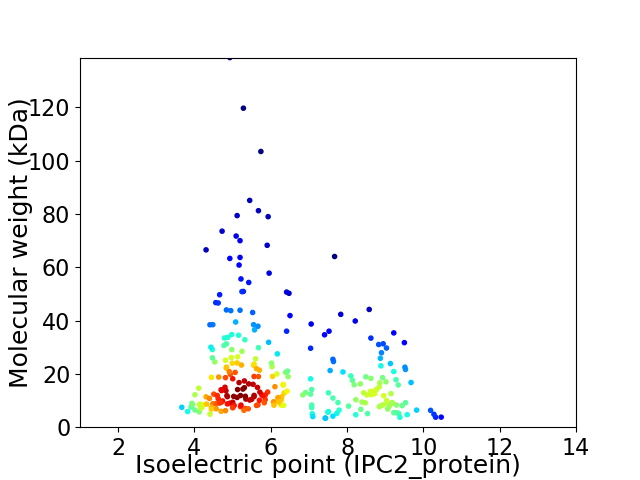
Virtual 2D-PAGE plot for 268 proteins (isoelectric point calculated using IPC2_protein)
Get csv file with sequences according to given criteria:
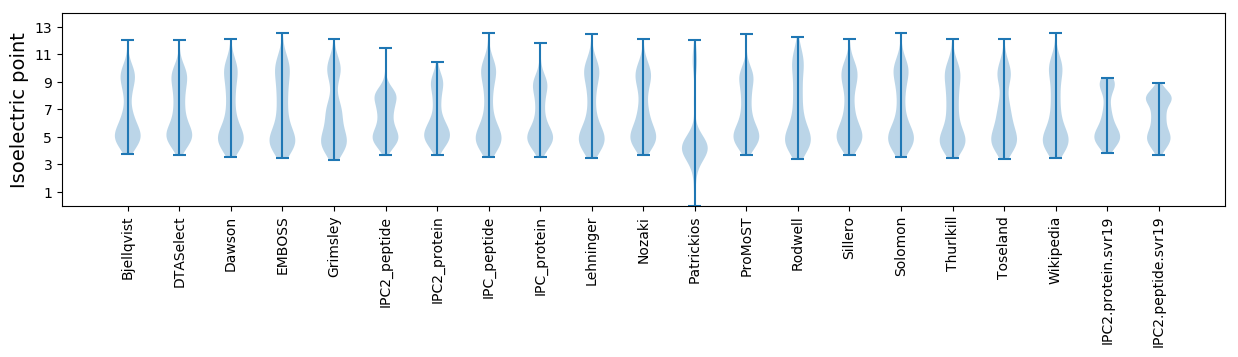
* You can choose from 21 different methods for calculating isoelectric point
Summary statistics related to proteome-wise predictions
Protein with the lowest isoelectric point:
>tr|M1HDH6|M1HDH6_9CAUD Uncharacterized protein OS=Salmonella phage vB_SenM-S16 OX=1087482 PE=4 SV=1
MM1 pKa = 7.1STATCTSTNIDD12 pKa = 3.4VFRR15 pKa = 11.84LFEE18 pKa = 4.56EE19 pKa = 4.68YY20 pKa = 10.94EE21 pKa = 3.95MTKK24 pKa = 9.94ISEE27 pKa = 4.42NIISVMSDD35 pKa = 2.68TDD37 pKa = 3.93VEE39 pKa = 4.41WFIPLYY45 pKa = 11.0DD46 pKa = 3.89EE47 pKa = 4.5DD48 pKa = 4.49TYY50 pKa = 11.82EE51 pKa = 4.07VTDD54 pKa = 3.97ANGNKK59 pKa = 9.93AVFVIDD65 pKa = 3.53
MM1 pKa = 7.1STATCTSTNIDD12 pKa = 3.4VFRR15 pKa = 11.84LFEE18 pKa = 4.56EE19 pKa = 4.68YY20 pKa = 10.94EE21 pKa = 3.95MTKK24 pKa = 9.94ISEE27 pKa = 4.42NIISVMSDD35 pKa = 2.68TDD37 pKa = 3.93VEE39 pKa = 4.41WFIPLYY45 pKa = 11.0DD46 pKa = 3.89EE47 pKa = 4.5DD48 pKa = 4.49TYY50 pKa = 11.82EE51 pKa = 4.07VTDD54 pKa = 3.97ANGNKK59 pKa = 9.93AVFVIDD65 pKa = 3.53
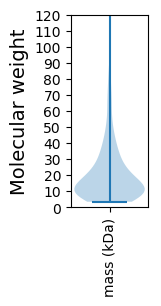
Molecular weight: 7.47 kDa
Isoelectric point according different methods:
Protein with the highest isoelectric point:
>tr|M1HDI5|M1HDI5_9CAUD RI lysis inhibition regulator OS=Salmonella phage vB_SenM-S16 OX=1087482 PE=4 SV=1
MM1 pKa = 6.32NTKK4 pKa = 9.95IIHH7 pKa = 6.36DD8 pKa = 4.02KK9 pKa = 10.94KK10 pKa = 11.14LDD12 pKa = 3.78GSCIWKK18 pKa = 9.37FVISNKK24 pKa = 10.32DD25 pKa = 3.28GTFTTVLSVSKK36 pKa = 8.8LTPRR40 pKa = 11.84LIRR43 pKa = 11.84RR44 pKa = 11.84YY45 pKa = 10.27KK46 pKa = 10.35RR47 pKa = 11.84INRR50 pKa = 11.84LFNFF54 pKa = 4.23
MM1 pKa = 6.32NTKK4 pKa = 9.95IIHH7 pKa = 6.36DD8 pKa = 4.02KK9 pKa = 10.94KK10 pKa = 11.14LDD12 pKa = 3.78GSCIWKK18 pKa = 9.37FVISNKK24 pKa = 10.32DD25 pKa = 3.28GTFTTVLSVSKK36 pKa = 8.8LTPRR40 pKa = 11.84LIRR43 pKa = 11.84RR44 pKa = 11.84YY45 pKa = 10.27KK46 pKa = 10.35RR47 pKa = 11.84INRR50 pKa = 11.84LFNFF54 pKa = 4.23
Molecular weight: 6.41 kDa
Isoelectric point according different methods:
Peptides (in silico digests for buttom-up proteomics)
Below you can find in silico digests of the whole proteome with Trypsin, Chymotrypsin, Trypsin+LysC, LysN, ArgC proteases suitable for different mass spec machines.| Try ESI |
 |
|---|
| ChTry ESI |
|
|---|
| ArgC ESI |
|
|---|
| LysN ESI |
|
|---|
| TryLysC ESI |
|
|---|
| Try MALDI |
|
|---|
| ChTry MALDI |
|
|---|
| ArgC MALDI |
|
|---|
| LysN MALDI |
|
|---|
| TryLysC MALDI |
|
|---|
| Try LTQ |
|
|---|
| ChTry LTQ |
|
|---|
| ArgC LTQ |
|
|---|
| LysN LTQ |
|
|---|
| TryLysC LTQ |
|
|---|
| Try MSlow |
|
|---|
| ChTry MSlow |
|
|---|
| ArgC MSlow |
|
|---|
| LysN MSlow |
|
|---|
| TryLysC MSlow |
|
|---|
| Try MShigh |
|
|---|
| ChTry MShigh |
|
|---|
| ArgC MShigh |
|
|---|
| LysN MShigh |
|
|---|
| TryLysC MShigh |
|
|---|
General Statistics
Number of major isoforms |
Number of additional isoforms |
Number of all proteins |
Number of amino acids |
Min. Seq. Length |
Max. Seq. Length |
Avg. Seq. Length |
Avg. Mol. Weight |
|---|---|---|---|---|---|---|---|
0 |
50790 |
29 |
1273 |
189.5 |
21.54 |
Amino acid frequency
Ala |
Cys |
Asp |
Glu |
Phe |
Gly |
His |
Ile |
Lys |
Leu |
|---|---|---|---|---|---|---|---|---|---|
6.385 ± 0.191 | 1.132 ± 0.075 |
6.214 ± 0.128 | 7.216 ± 0.153 |
4.328 ± 0.106 | 6.129 ± 0.192 |
1.776 ± 0.081 | 7.334 ± 0.134 |
7.726 ± 0.216 | 7.545 ± 0.11 |
Met |
Asn |
Gln |
Pro |
Arg |
Ser |
Thr |
Val |
Trp |
Tyr |
|---|---|---|---|---|---|---|---|---|---|
2.884 ± 0.098 | 5.792 ± 0.12 |
3.386 ± 0.104 | 3.262 ± 0.094 |
4.426 ± 0.101 | 6.523 ± 0.139 |
5.729 ± 0.211 | 6.511 ± 0.145 |
1.516 ± 0.069 | 4.184 ± 0.129 |
Most of the basic statistics you can see at this page can be downloaded from this CSV file
See this proteome in:

Proteome-pI is available under Creative Commons Attribution-NoDerivs license, for more details see here
| Reference: Kozlowski LP. Proteome-pI 2.0: Proteome Isoelectric Point Database Update. Nucleic Acids Res. 2021, doi: 10.1093/nar/gkab944 | Contact: Lukasz P. Kozlowski |