Candidatus Nitrospira inopinata
Taxonomy: cellular organisms; Bacteria; Nitrospirae; Nitrospira; Nitrospirales; Nitrospiraceae; Nitrospira
Average proteome isoelectric point is 6.98
Get precalculated fractions of proteins
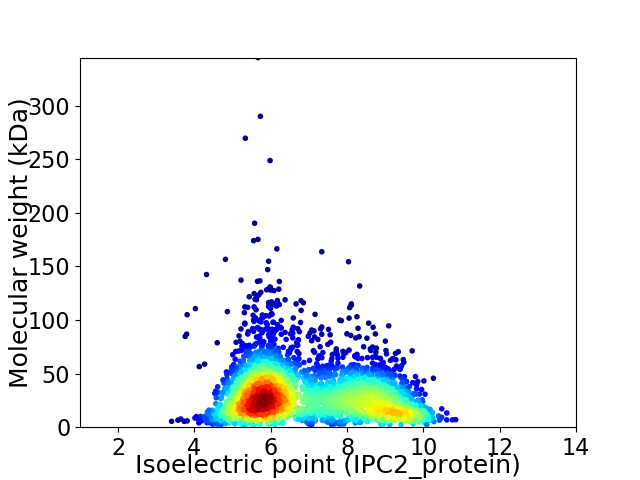
Virtual 2D-PAGE plot for 3371 proteins (isoelectric point calculated using IPC2_protein)
Get csv file with sequences according to given criteria:
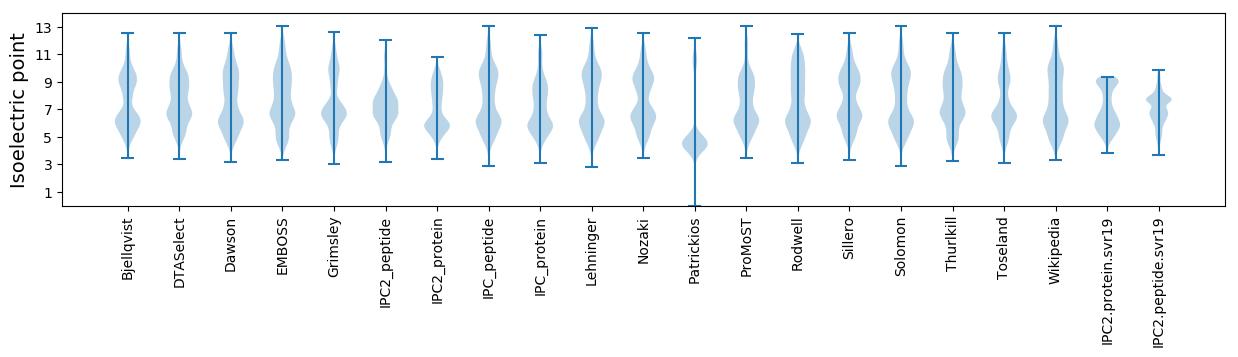
* You can choose from 21 different methods for calculating isoelectric point
Summary statistics related to proteome-wise predictions
Protein with the lowest isoelectric point:
>tr|A0A0S4KRW4|A0A0S4KRW4_9BACT Uncharacterized protein OS=Candidatus Nitrospira inopinata OX=1715989 GN=NITINOP_2215 PE=4 SV=1
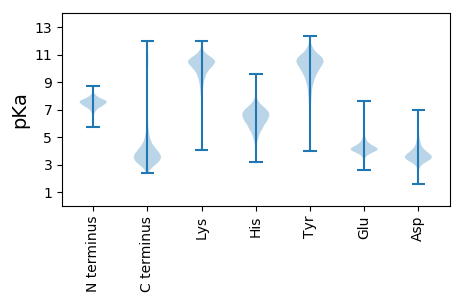
MM1 pKa = 7.68RR2 pKa = 11.84WFNFVGWGMLALAVMLDD19 pKa = 3.18EE20 pKa = 4.52WLYY23 pKa = 10.81LYY25 pKa = 10.62LWEE28 pKa = 4.42EE29 pKa = 4.29FNVGVVVAAAIYY41 pKa = 9.53LVVAIGLSVWGGRR54 pKa = 11.84STDD57 pKa = 3.44PDD59 pKa = 3.3
MM1 pKa = 7.68RR2 pKa = 11.84WFNFVGWGMLALAVMLDD19 pKa = 3.18EE20 pKa = 4.52WLYY23 pKa = 10.81LYY25 pKa = 10.62LWEE28 pKa = 4.42EE29 pKa = 4.29FNVGVVVAAAIYY41 pKa = 9.53LVVAIGLSVWGGRR54 pKa = 11.84STDD57 pKa = 3.44PDD59 pKa = 3.3
Molecular weight: 6.71 kDa
Isoelectric point according different methods:
Protein with the highest isoelectric point:
>tr|A0A0S4KX91|A0A0S4KX91_9BACT TIR domain-containing protein OS=Candidatus Nitrospira inopinata OX=1715989 GN=NITINOP_2996 PE=4 SV=1
MM1 pKa = 7.62KK2 pKa = 10.14MKK4 pKa = 8.76THH6 pKa = 6.83KK7 pKa = 10.46GASKK11 pKa = 10.55RR12 pKa = 11.84FAKK15 pKa = 9.86TGSGKK20 pKa = 9.67IVRR23 pKa = 11.84RR24 pKa = 11.84KK25 pKa = 9.24AGKK28 pKa = 9.56RR29 pKa = 11.84HH30 pKa = 5.68LLSHH34 pKa = 7.22KK35 pKa = 10.39KK36 pKa = 9.59RR37 pKa = 11.84DD38 pKa = 3.41RR39 pKa = 11.84KK40 pKa = 10.22RR41 pKa = 11.84RR42 pKa = 11.84LSGAAVVVGRR52 pKa = 11.84ATAVLNQLLSKK63 pKa = 10.89
MM1 pKa = 7.62KK2 pKa = 10.14MKK4 pKa = 8.76THH6 pKa = 6.83KK7 pKa = 10.46GASKK11 pKa = 10.55RR12 pKa = 11.84FAKK15 pKa = 9.86TGSGKK20 pKa = 9.67IVRR23 pKa = 11.84RR24 pKa = 11.84KK25 pKa = 9.24AGKK28 pKa = 9.56RR29 pKa = 11.84HH30 pKa = 5.68LLSHH34 pKa = 7.22KK35 pKa = 10.39KK36 pKa = 9.59RR37 pKa = 11.84DD38 pKa = 3.41RR39 pKa = 11.84KK40 pKa = 10.22RR41 pKa = 11.84RR42 pKa = 11.84LSGAAVVVGRR52 pKa = 11.84ATAVLNQLLSKK63 pKa = 10.89
Molecular weight: 7.01 kDa
Isoelectric point according different methods:
Peptides (in silico digests for buttom-up proteomics)
Below you can find in silico digests of the whole proteome with Trypsin, Chymotrypsin, Trypsin+LysC, LysN, ArgC proteases suitable for different mass spec machines.| Try ESI |
 |
|---|
| ChTry ESI |
|
|---|
| ArgC ESI |
|
|---|
| LysN ESI |
|
|---|
| TryLysC ESI |
|
|---|
| Try MALDI |
|
|---|
| ChTry MALDI |
|
|---|
| ArgC MALDI |
|
|---|
| LysN MALDI |
|
|---|
| TryLysC MALDI |
|
|---|
| Try LTQ |
|
|---|
| ChTry LTQ |
|
|---|
| ArgC LTQ |
|
|---|
| LysN LTQ |
|
|---|
| TryLysC LTQ |
|
|---|
| Try MSlow |
|
|---|
| ChTry MSlow |
|
|---|
| ArgC MSlow |
|
|---|
| LysN MSlow |
|
|---|
| TryLysC MSlow |
|
|---|
| Try MShigh |
|
|---|
| ChTry MShigh |
|
|---|
| ArgC MShigh |
|
|---|
| LysN MShigh |
|
|---|
| TryLysC MShigh |
|
|---|
General Statistics
Number of major isoforms |
Number of additional isoforms |
Number of all proteins |
Number of amino acids |
Min. Seq. Length |
Max. Seq. Length |
Avg. Seq. Length |
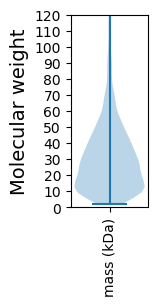
Avg. Mol. Weight |
|---|---|---|---|---|---|---|---|
0 |
990833 |
20 |
3074 |
293.9 |
32.41 |
Amino acid frequency
Ala |
Cys |
Asp |
Glu |
Phe |
Gly |
His |
Ile |
Lys |
Leu |
|---|---|---|---|---|---|---|---|---|---|
9.906 ± 0.046 | 1.03 ± 0.015 |
5.256 ± 0.032 | 6.272 ± 0.036 |
3.595 ± 0.023 | 8.081 ± 0.048 |
2.294 ± 0.025 | 5.137 ± 0.032 |
3.944 ± 0.033 | 10.447 ± 0.051 |
Met |
Asn |
Gln |
Pro |
Arg |
Ser |
Thr |
Val |
Trp |
Tyr |
|---|---|---|---|---|---|---|---|---|---|
2.348 ± 0.023 | 2.507 ± 0.023 |
5.253 ± 0.035 | 3.494 ± 0.023 |
7.634 ± 0.048 | 5.663 ± 0.032 |
5.398 ± 0.029 | 7.918 ± 0.039 |
1.354 ± 0.019 | 2.47 ± 0.024 |
Most of the basic statistics you can see at this page can be downloaded from this CSV file
See this proteome in:

Proteome-pI is available under Creative Commons Attribution-NoDerivs license, for more details see here
| Reference: Kozlowski LP. Proteome-pI 2.0: Proteome Isoelectric Point Database Update. Nucleic Acids Res. 2021, doi: 10.1093/nar/gkab944 | Contact: Lukasz P. Kozlowski |