Gordonia phage Bakery
Taxonomy: Viruses; Duplodnaviria; Heunggongvirae; Uroviricota; Caudoviricetes; Caudovirales; Siphoviridae; Wizardvirus; unclassified Wizardvirus
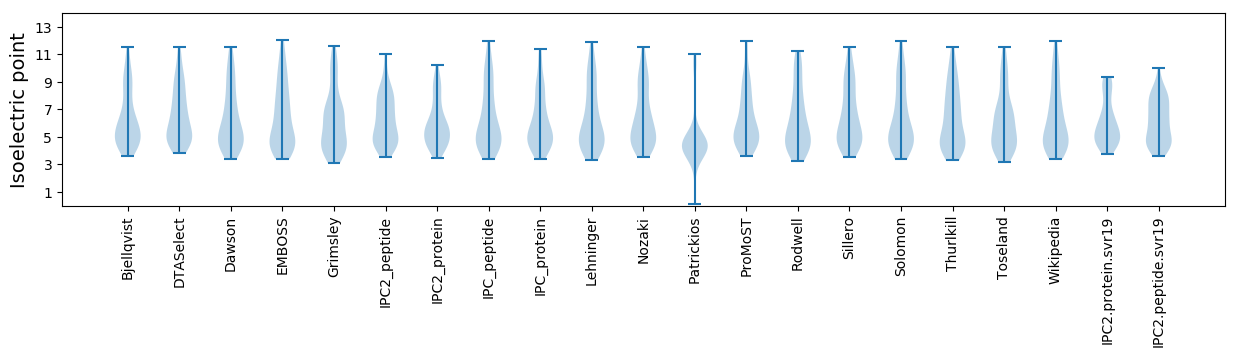
Average proteome isoelectric point is 6.07
Get precalculated fractions of proteins
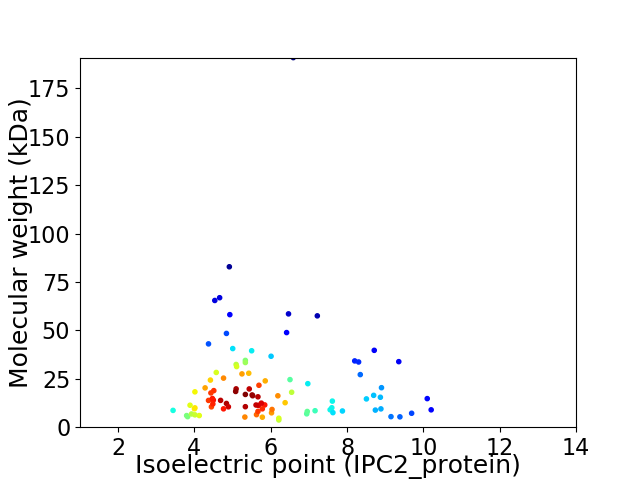
Virtual 2D-PAGE plot for 96 proteins (isoelectric point calculated using IPC2_protein)
Get csv file with sequences according to given criteria:
* You can choose from 21 different methods for calculating isoelectric point
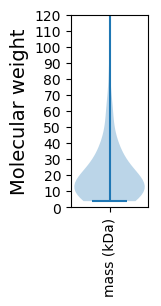
Summary statistics related to proteome-wise predictions
Protein with the lowest isoelectric point:
>tr|A0A514DGU2|A0A514DGU2_9CAUD Uncharacterized protein OS=Gordonia phage Bakery OX=2591205 GN=38 PE=4 SV=1
MM1 pKa = 7.62FEE3 pKa = 4.42FDD5 pKa = 3.98IDD7 pKa = 3.81TSLGLCEE14 pKa = 5.96FPGCSQWATTVTEE27 pKa = 4.42RR28 pKa = 11.84TEE30 pKa = 3.5HH31 pKa = 6.09WLADD35 pKa = 3.89PEE37 pKa = 4.74LSDD40 pKa = 5.7DD41 pKa = 3.38GWANVCTDD49 pKa = 4.37HH50 pKa = 7.52APASS54 pKa = 3.79
MM1 pKa = 7.62FEE3 pKa = 4.42FDD5 pKa = 3.98IDD7 pKa = 3.81TSLGLCEE14 pKa = 5.96FPGCSQWATTVTEE27 pKa = 4.42RR28 pKa = 11.84TEE30 pKa = 3.5HH31 pKa = 6.09WLADD35 pKa = 3.89PEE37 pKa = 4.74LSDD40 pKa = 5.7DD41 pKa = 3.38GWANVCTDD49 pKa = 4.37HH50 pKa = 7.52APASS54 pKa = 3.79
Molecular weight: 6.0 kDa
Isoelectric point according different methods:
Protein with the highest isoelectric point:
>tr|A0A514DGV0|A0A514DGV0_9CAUD Uncharacterized protein OS=Gordonia phage Bakery OX=2591205 GN=47 PE=4 SV=1
MM1 pKa = 7.78HH2 pKa = 7.55DD3 pKa = 3.97HH4 pKa = 6.19ATKK7 pKa = 9.97TLSASAASTEE17 pKa = 3.98SGIPKK22 pKa = 8.89RR23 pKa = 11.84TILYY27 pKa = 9.85AIQTRR32 pKa = 11.84KK33 pKa = 9.7LRR35 pKa = 11.84AEE37 pKa = 4.15KK38 pKa = 10.64LPGAGYY44 pKa = 9.75VIRR47 pKa = 11.84RR48 pKa = 11.84RR49 pKa = 11.84DD50 pKa = 3.51FEE52 pKa = 3.82RR53 pKa = 11.84WRR55 pKa = 11.84EE56 pKa = 3.86SRR58 pKa = 11.84EE59 pKa = 3.91QVASS63 pKa = 3.62
MM1 pKa = 7.78HH2 pKa = 7.55DD3 pKa = 3.97HH4 pKa = 6.19ATKK7 pKa = 9.97TLSASAASTEE17 pKa = 3.98SGIPKK22 pKa = 8.89RR23 pKa = 11.84TILYY27 pKa = 9.85AIQTRR32 pKa = 11.84KK33 pKa = 9.7LRR35 pKa = 11.84AEE37 pKa = 4.15KK38 pKa = 10.64LPGAGYY44 pKa = 9.75VIRR47 pKa = 11.84RR48 pKa = 11.84RR49 pKa = 11.84DD50 pKa = 3.51FEE52 pKa = 3.82RR53 pKa = 11.84WRR55 pKa = 11.84EE56 pKa = 3.86SRR58 pKa = 11.84EE59 pKa = 3.91QVASS63 pKa = 3.62
Molecular weight: 7.2 kDa
Isoelectric point according different methods:
Peptides (in silico digests for buttom-up proteomics)
Below you can find in silico digests of the whole proteome with Trypsin, Chymotrypsin, Trypsin+LysC, LysN, ArgC proteases suitable for different mass spec machines.| Try ESI |
 |
|---|
| ChTry ESI |
|
|---|
| ArgC ESI |
|
|---|
| LysN ESI |
|
|---|
| TryLysC ESI |
|
|---|
| Try MALDI |
|
|---|
| ChTry MALDI |
|
|---|
| ArgC MALDI |
|
|---|
| LysN MALDI |
|
|---|
| TryLysC MALDI |
|
|---|
| Try LTQ |
|
|---|
| ChTry LTQ |
|
|---|
| ArgC LTQ |
|
|---|
| LysN LTQ |
|
|---|
| TryLysC LTQ |
|
|---|
| Try MSlow |
|
|---|
| ChTry MSlow |
|
|---|
| ArgC MSlow |
|
|---|
| LysN MSlow |
|
|---|
| TryLysC MSlow |
|
|---|
| Try MShigh |
|
|---|
| ChTry MShigh |
|
|---|
| ArgC MShigh |
|
|---|
| LysN MShigh |
|
|---|
| TryLysC MShigh |
|
|---|
General Statistics
Number of major isoforms |
Number of additional isoforms |
Number of all proteins |
Number of amino acids |
Min. Seq. Length |
Max. Seq. Length |
Avg. Seq. Length |
Avg. Mol. Weight |
|---|---|---|---|---|---|---|---|
0 |
19319 |
34 |
1838 |
201.2 |
21.94 |
Amino acid frequency
Ala |
Cys |
Asp |
Glu |
Phe |
Gly |
His |
Ile |
Lys |
Leu |
|---|---|---|---|---|---|---|---|---|---|
12.237 ± 0.392 | 0.958 ± 0.129 |
7.174 ± 0.298 | 5.689 ± 0.261 |
2.542 ± 0.139 | 8.246 ± 0.509 |
2.179 ± 0.161 | 4.245 ± 0.191 |
2.754 ± 0.208 | 7.946 ± 0.232 |
Met |
Asn |
Gln |
Pro |
Arg |
Ser |
Thr |
Val |
Trp |
Tyr |
|---|---|---|---|---|---|---|---|---|---|
2.102 ± 0.121 | 2.93 ± 0.142 |
6.331 ± 0.307 | 3.406 ± 0.158 |
7.795 ± 0.387 | 5.021 ± 0.169 |
6.812 ± 0.245 | 7.309 ± 0.167 |
2.371 ± 0.13 | 1.957 ± 0.138 |
Most of the basic statistics you can see at this page can be downloaded from this CSV file
See this proteome in:

Proteome-pI is available under Creative Commons Attribution-NoDerivs license, for more details see here
| Reference: Kozlowski LP. Proteome-pI 2.0: Proteome Isoelectric Point Database Update. Nucleic Acids Res. 2021, doi: 10.1093/nar/gkab944 | Contact: Lukasz P. Kozlowski |