Anaerococcus prevotii ACS-065-V-Col13
Taxonomy: cellular organisms; Bacteria; Terrabacteria group; Firmicutes; Tissierellia; Tissierellales; Peptoniphilaceae; Anaerococcus; Anaerococcus prevotii
Average proteome isoelectric point is 6.15
Get precalculated fractions of proteins
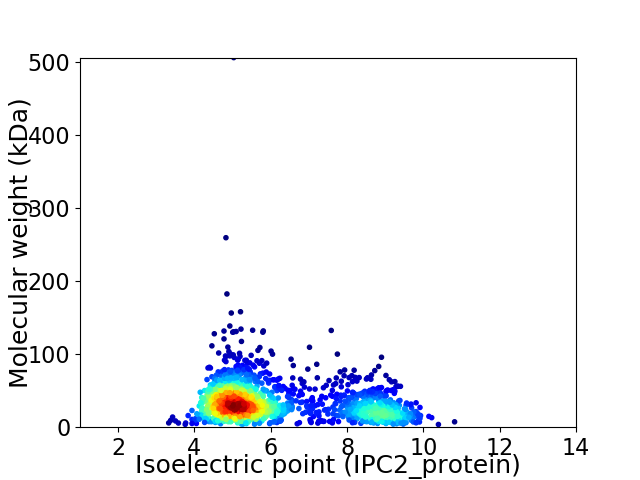
Virtual 2D-PAGE plot for 1634 proteins (isoelectric point calculated using IPC2_protein)
Get csv file with sequences according to given criteria:
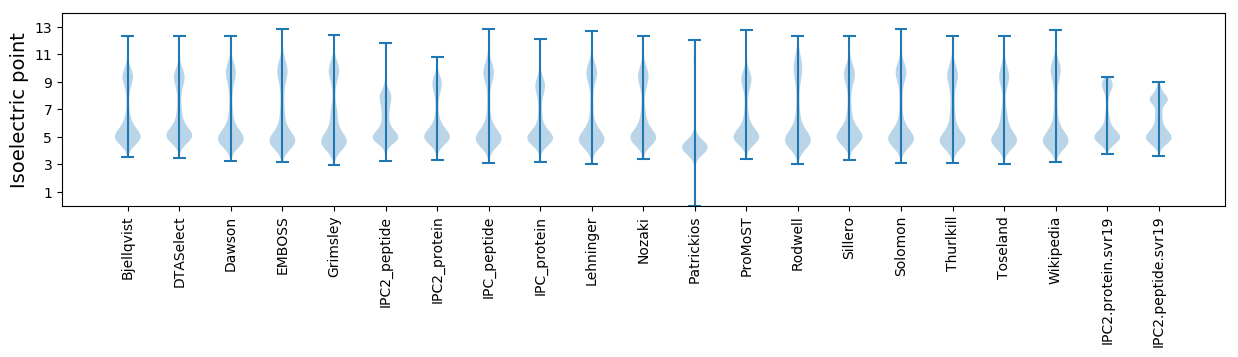
* You can choose from 21 different methods for calculating isoelectric point
Summary statistics related to proteome-wise predictions
Protein with the lowest isoelectric point:
>tr|F0GVF7|F0GVF7_9FIRM Phosphomethylpyrimidine kinase OS=Anaerococcus prevotii ACS-065-V-Col13 OX=879305 GN=thiD PE=3 SV=1
MM1 pKa = 7.57PADD4 pKa = 5.82LINDD8 pKa = 4.64MIPFLGILDD17 pKa = 4.06DD18 pKa = 5.76AIVLPFLIYY27 pKa = 9.12ITSSNLYY34 pKa = 9.89NKK36 pKa = 10.12QNDD39 pKa = 3.23PRR41 pKa = 11.84FSYY44 pKa = 11.0GG45 pKa = 3.03
MM1 pKa = 7.57PADD4 pKa = 5.82LINDD8 pKa = 4.64MIPFLGILDD17 pKa = 4.06DD18 pKa = 5.76AIVLPFLIYY27 pKa = 9.12ITSSNLYY34 pKa = 9.89NKK36 pKa = 10.12QNDD39 pKa = 3.23PRR41 pKa = 11.84FSYY44 pKa = 11.0GG45 pKa = 3.03
Molecular weight: 5.12 kDa
Isoelectric point according different methods:
Protein with the highest isoelectric point:
>tr|F0GV62|F0GV62_9FIRM 50S ribosomal protein L14 OS=Anaerococcus prevotii ACS-065-V-Col13 OX=879305 GN=rplN PE=3 SV=1
MM1 pKa = 7.56AKK3 pKa = 10.0KK4 pKa = 10.26SLRR7 pKa = 11.84AKK9 pKa = 7.7QQRR12 pKa = 11.84KK13 pKa = 7.12QKK15 pKa = 10.37FSTRR19 pKa = 11.84EE20 pKa = 3.49YY21 pKa = 10.91SRR23 pKa = 11.84CKK25 pKa = 10.36LCGRR29 pKa = 11.84PHH31 pKa = 6.86GYY33 pKa = 9.06LRR35 pKa = 11.84KK36 pKa = 10.07YY37 pKa = 9.32GICRR41 pKa = 11.84ICFRR45 pKa = 11.84EE46 pKa = 3.99LANNGQIPGVKK57 pKa = 9.29KK58 pKa = 10.9ASWW61 pKa = 3.03
MM1 pKa = 7.56AKK3 pKa = 10.0KK4 pKa = 10.26SLRR7 pKa = 11.84AKK9 pKa = 7.7QQRR12 pKa = 11.84KK13 pKa = 7.12QKK15 pKa = 10.37FSTRR19 pKa = 11.84EE20 pKa = 3.49YY21 pKa = 10.91SRR23 pKa = 11.84CKK25 pKa = 10.36LCGRR29 pKa = 11.84PHH31 pKa = 6.86GYY33 pKa = 9.06LRR35 pKa = 11.84KK36 pKa = 10.07YY37 pKa = 9.32GICRR41 pKa = 11.84ICFRR45 pKa = 11.84EE46 pKa = 3.99LANNGQIPGVKK57 pKa = 9.29KK58 pKa = 10.9ASWW61 pKa = 3.03
Molecular weight: 7.18 kDa
Isoelectric point according different methods:
Peptides (in silico digests for buttom-up proteomics)
Below you can find in silico digests of the whole proteome with Trypsin, Chymotrypsin, Trypsin+LysC, LysN, ArgC proteases suitable for different mass spec machines.| Try ESI |
 |
|---|
| ChTry ESI |
|
|---|
| ArgC ESI |
|
|---|
| LysN ESI |
|
|---|
| TryLysC ESI |
|
|---|
| Try MALDI |
|
|---|
| ChTry MALDI |
|
|---|
| ArgC MALDI |
|
|---|
| LysN MALDI |
|
|---|
| TryLysC MALDI |
|
|---|
| Try LTQ |
|
|---|
| ChTry LTQ |
|
|---|
| ArgC LTQ |
|
|---|
| LysN LTQ |
|
|---|
| TryLysC LTQ |
|
|---|
| Try MSlow |
|
|---|
| ChTry MSlow |
|
|---|
| ArgC MSlow |
|
|---|
| LysN MSlow |
|
|---|
| TryLysC MSlow |
|
|---|
| Try MShigh |
|
|---|
| ChTry MShigh |
|
|---|
| ArgC MShigh |
|
|---|
| LysN MShigh |
|
|---|
| TryLysC MShigh |
|
|---|
General Statistics
Number of major isoforms |
Number of additional isoforms |
Number of all proteins |
Number of amino acids |
Min. Seq. Length |
Max. Seq. Length |
Avg. Seq. Length |
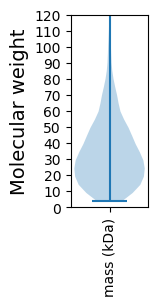
Avg. Mol. Weight |
|---|---|---|---|---|---|---|---|
0 |
511794 |
32 |
4524 |
313.2 |
35.43 |
Amino acid frequency
Ala |
Cys |
Asp |
Glu |
Phe |
Gly |
His |
Ile |
Lys |
Leu |
|---|---|---|---|---|---|---|---|---|---|
5.904 ± 0.061 | 0.733 ± 0.02 |
7.053 ± 0.064 | 7.643 ± 0.068 |
4.551 ± 0.054 | 6.255 ± 0.054 |
1.264 ± 0.023 | 9.352 ± 0.072 |
8.982 ± 0.067 | 9.124 ± 0.075 |
Met |
Asn |
Gln |
Pro |
Arg |
Ser |
Thr |
Val |
Trp |
Tyr |
|---|---|---|---|---|---|---|---|---|---|
2.565 ± 0.03 | 5.902 ± 0.045 |
2.664 ± 0.034 | 2.203 ± 0.028 |
3.693 ± 0.046 | 6.478 ± 0.05 |
4.734 ± 0.047 | 6.118 ± 0.049 |
0.572 ± 0.015 | 4.209 ± 0.042 |
Most of the basic statistics you can see at this page can be downloaded from this CSV file
See this proteome in:

Proteome-pI is available under Creative Commons Attribution-NoDerivs license, for more details see here
| Reference: Kozlowski LP. Proteome-pI 2.0: Proteome Isoelectric Point Database Update. Nucleic Acids Res. 2021, doi: 10.1093/nar/gkab944 | Contact: Lukasz P. Kozlowski |