Aeromonas phage PS
Taxonomy: Viruses; Duplodnaviria; Heunggongvirae; Uroviricota; Caudoviricetes; Caudovirales; Autographiviridae; unclassified Autographiviridae
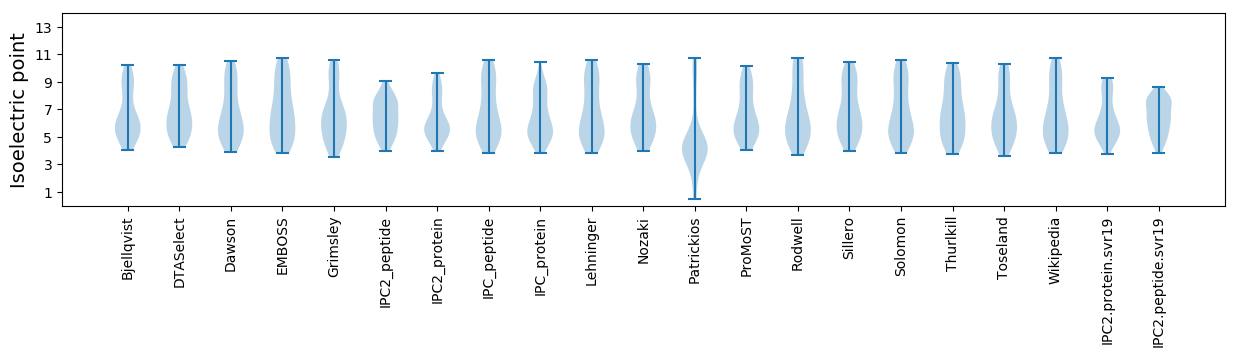
Average proteome isoelectric point is 6.36
Get precalculated fractions of proteins
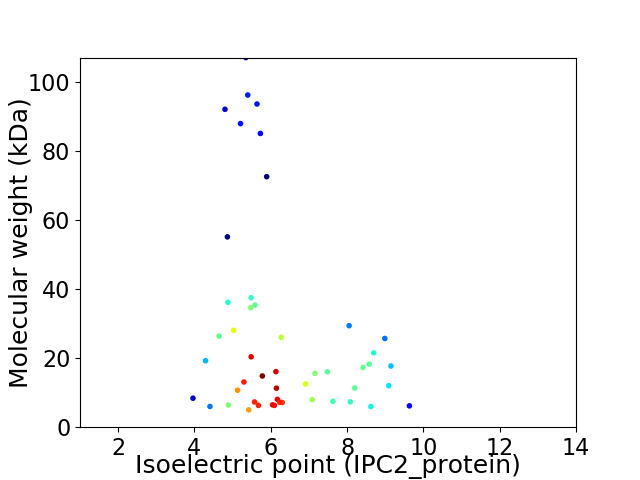
Virtual 2D-PAGE plot for 49 proteins (isoelectric point calculated using IPC2_protein)
Get csv file with sequences according to given criteria:
* You can choose from 21 different methods for calculating isoelectric point
Summary statistics related to proteome-wise predictions
Protein with the lowest isoelectric point:
>tr|A0A6H0X6P2|A0A6H0X6P2_9CAUD DNA maturase B OS=Aeromonas phage PS OX=2723762 PE=4 SV=1
MM1 pKa = 7.93DD2 pKa = 5.18FAPTTNYY9 pKa = 9.83IVDD12 pKa = 3.45VTTADD17 pKa = 3.52KK18 pKa = 11.37AEE20 pKa = 4.28LMAALAGVSGIVSVQDD36 pKa = 3.01GGVYY40 pKa = 10.09RR41 pKa = 11.84EE42 pKa = 4.44DD43 pKa = 3.25NAYY46 pKa = 10.21SQVHH50 pKa = 5.86IEE52 pKa = 4.22ALNAVWTLKK61 pKa = 10.64QLDD64 pKa = 3.78ALLYY68 pKa = 9.3SLNYY72 pKa = 10.15DD73 pKa = 3.3VVGIVV78 pKa = 3.18
MM1 pKa = 7.93DD2 pKa = 5.18FAPTTNYY9 pKa = 9.83IVDD12 pKa = 3.45VTTADD17 pKa = 3.52KK18 pKa = 11.37AEE20 pKa = 4.28LMAALAGVSGIVSVQDD36 pKa = 3.01GGVYY40 pKa = 10.09RR41 pKa = 11.84EE42 pKa = 4.44DD43 pKa = 3.25NAYY46 pKa = 10.21SQVHH50 pKa = 5.86IEE52 pKa = 4.22ALNAVWTLKK61 pKa = 10.64QLDD64 pKa = 3.78ALLYY68 pKa = 9.3SLNYY72 pKa = 10.15DD73 pKa = 3.3VVGIVV78 pKa = 3.18
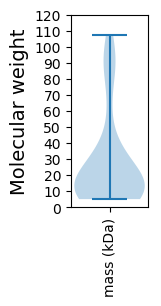
Molecular weight: 8.41 kDa
Isoelectric point according different methods:
Protein with the highest isoelectric point:
>tr|A0A6H0X6S9|A0A6H0X6S9_9CAUD DNA primase OS=Aeromonas phage PS OX=2723762 PE=4 SV=1
MM1 pKa = 6.97RR2 pKa = 11.84TRR4 pKa = 11.84RR5 pKa = 11.84EE6 pKa = 3.87ATQLRR11 pKa = 11.84IQRR14 pKa = 11.84RR15 pKa = 11.84KK16 pKa = 8.4EE17 pKa = 3.73AEE19 pKa = 3.81EE20 pKa = 4.04ALEE23 pKa = 3.99QQRR26 pKa = 11.84RR27 pKa = 11.84DD28 pKa = 3.25AAQKK32 pKa = 10.71LGISYY37 pKa = 9.31EE38 pKa = 4.2SYY40 pKa = 8.48MARR43 pKa = 11.84FIHH46 pKa = 6.66LKK48 pKa = 10.07VGYY51 pKa = 9.94
MM1 pKa = 6.97RR2 pKa = 11.84TRR4 pKa = 11.84RR5 pKa = 11.84EE6 pKa = 3.87ATQLRR11 pKa = 11.84IQRR14 pKa = 11.84RR15 pKa = 11.84KK16 pKa = 8.4EE17 pKa = 3.73AEE19 pKa = 3.81EE20 pKa = 4.04ALEE23 pKa = 3.99QQRR26 pKa = 11.84RR27 pKa = 11.84DD28 pKa = 3.25AAQKK32 pKa = 10.71LGISYY37 pKa = 9.31EE38 pKa = 4.2SYY40 pKa = 8.48MARR43 pKa = 11.84FIHH46 pKa = 6.66LKK48 pKa = 10.07VGYY51 pKa = 9.94
Molecular weight: 6.18 kDa
Isoelectric point according different methods:
Peptides (in silico digests for buttom-up proteomics)
Below you can find in silico digests of the whole proteome with Trypsin, Chymotrypsin, Trypsin+LysC, LysN, ArgC proteases suitable for different mass spec machines.| Try ESI |
 |
|---|
| ChTry ESI |
|
|---|
| ArgC ESI |
|
|---|
| LysN ESI |
|
|---|
| TryLysC ESI |
|
|---|
| Try MALDI |
|
|---|
| ChTry MALDI |
|
|---|
| ArgC MALDI |
|
|---|
| LysN MALDI |
|
|---|
| TryLysC MALDI |
|
|---|
| Try LTQ |
|
|---|
| ChTry LTQ |
|
|---|
| ArgC LTQ |
|
|---|
| LysN LTQ |
|
|---|
| TryLysC LTQ |
|
|---|
| Try MSlow |
|
|---|
| ChTry MSlow |
|
|---|
| ArgC MSlow |
|
|---|
| LysN MSlow |
|
|---|
| TryLysC MSlow |
|
|---|
| Try MShigh |
|
|---|
| ChTry MShigh |
|
|---|
| ArgC MShigh |
|
|---|
| LysN MShigh |
|
|---|
| TryLysC MShigh |
|
|---|
General Statistics
Number of major isoforms |
Number of additional isoforms |
Number of all proteins |
Number of amino acids |
Min. Seq. Length |
Max. Seq. Length |
Avg. Seq. Length |
Avg. Mol. Weight |
|---|---|---|---|---|---|---|---|
0 |
12012 |
42 |
991 |
245.1 |
27.09 |
Amino acid frequency
Ala |
Cys |
Asp |
Glu |
Phe |
Gly |
His |
Ile |
Lys |
Leu |
|---|---|---|---|---|---|---|---|---|---|
9.807 ± 0.572 | 1.199 ± 0.19 |
5.794 ± 0.192 | 6.011 ± 0.387 |
3.272 ± 0.186 | 7.243 ± 0.396 |
1.79 ± 0.165 | 4.62 ± 0.242 |
5.47 ± 0.326 | 8.625 ± 0.284 |
Met |
Asn |
Gln |
Pro |
Arg |
Ser |
Thr |
Val |
Trp |
Tyr |
|---|---|---|---|---|---|---|---|---|---|
2.697 ± 0.198 | 4.113 ± 0.293 |
4.104 ± 0.321 | 4.462 ± 0.277 |
5.07 ± 0.29 | 6.419 ± 0.38 |
6.227 ± 0.313 | 7.801 ± 0.341 |
1.399 ± 0.11 | 3.879 ± 0.254 |
Most of the basic statistics you can see at this page can be downloaded from this CSV file
See this proteome in:

Proteome-pI is available under Creative Commons Attribution-NoDerivs license, for more details see here
| Reference: Kozlowski LP. Proteome-pI 2.0: Proteome Isoelectric Point Database Update. Nucleic Acids Res. 2021, doi: 10.1093/nar/gkab944 | Contact: Lukasz P. Kozlowski |