Streptomyces caatingaensis
Taxonomy: cellular organisms; Bacteria; Terrabacteria group; Actinobacteria; Actinomycetia; Streptomycetales; Streptomycetaceae; Streptomyces
Average proteome isoelectric point is 6.8
Get precalculated fractions of proteins
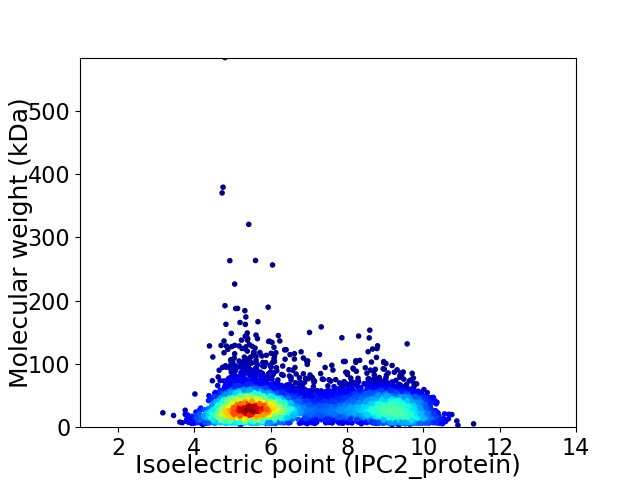
Virtual 2D-PAGE plot for 5460 proteins (isoelectric point calculated using IPC2_protein)
Get csv file with sequences according to given criteria:
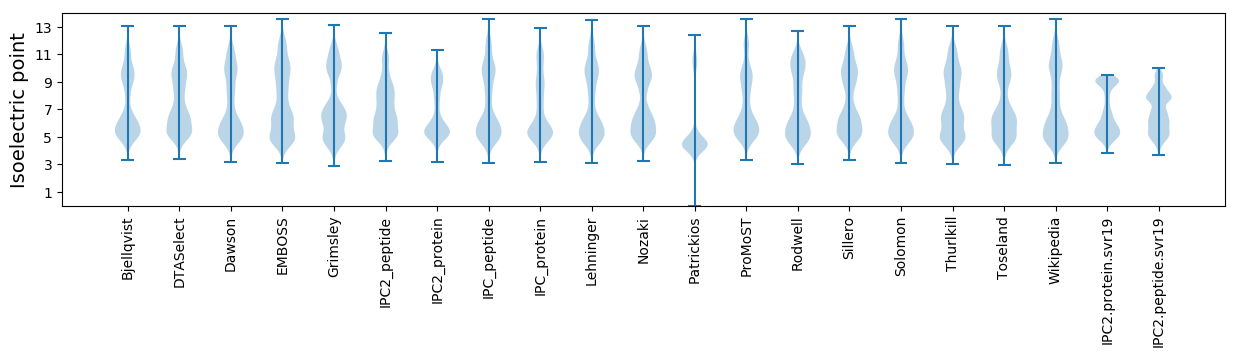
* You can choose from 21 different methods for calculating isoelectric point
Summary statistics related to proteome-wise predictions
Protein with the lowest isoelectric point:
>tr|A0A0K9X9T4|A0A0K9X9T4_9ACTN Membrane protein OS=Streptomyces caatingaensis OX=1678637 GN=AC230_24265 PE=4 SV=1
MM1 pKa = 7.07RR2 pKa = 11.84TAIVSAALAAAVSVFGIPAAAQAQPADD29 pKa = 3.89VDD31 pKa = 4.09LGTCIEE37 pKa = 4.21NGGYY41 pKa = 9.67PDD43 pKa = 3.51VTEE46 pKa = 4.27NGSWVCVDD54 pKa = 3.6GTSNGQPISDD64 pKa = 4.76LDD66 pKa = 3.93PVPVHH71 pKa = 6.72
MM1 pKa = 7.07RR2 pKa = 11.84TAIVSAALAAAVSVFGIPAAAQAQPADD29 pKa = 3.89VDD31 pKa = 4.09LGTCIEE37 pKa = 4.21NGGYY41 pKa = 9.67PDD43 pKa = 3.51VTEE46 pKa = 4.27NGSWVCVDD54 pKa = 3.6GTSNGQPISDD64 pKa = 4.76LDD66 pKa = 3.93PVPVHH71 pKa = 6.72
Molecular weight: 7.11 kDa
Isoelectric point according different methods:
Protein with the highest isoelectric point:
>tr|A0A0K9X821|A0A0K9X821_9ACTN Uncharacterized protein OS=Streptomyces caatingaensis OX=1678637 GN=AC230_29525 PE=4 SV=1
MM1 pKa = 7.69SKK3 pKa = 9.0RR4 pKa = 11.84TFQPNNRR11 pKa = 11.84RR12 pKa = 11.84RR13 pKa = 11.84AKK15 pKa = 8.7THH17 pKa = 5.15GFRR20 pKa = 11.84LRR22 pKa = 11.84MRR24 pKa = 11.84TRR26 pKa = 11.84AGRR29 pKa = 11.84AILASRR35 pKa = 11.84RR36 pKa = 11.84SKK38 pKa = 10.75GRR40 pKa = 11.84ARR42 pKa = 11.84LSAA45 pKa = 3.91
MM1 pKa = 7.69SKK3 pKa = 9.0RR4 pKa = 11.84TFQPNNRR11 pKa = 11.84RR12 pKa = 11.84RR13 pKa = 11.84AKK15 pKa = 8.7THH17 pKa = 5.15GFRR20 pKa = 11.84LRR22 pKa = 11.84MRR24 pKa = 11.84TRR26 pKa = 11.84AGRR29 pKa = 11.84AILASRR35 pKa = 11.84RR36 pKa = 11.84SKK38 pKa = 10.75GRR40 pKa = 11.84ARR42 pKa = 11.84LSAA45 pKa = 3.91
Molecular weight: 5.28 kDa
Isoelectric point according different methods:
Peptides (in silico digests for buttom-up proteomics)
Below you can find in silico digests of the whole proteome with Trypsin, Chymotrypsin, Trypsin+LysC, LysN, ArgC proteases suitable for different mass spec machines.| Try ESI |
 |
|---|
| ChTry ESI |
|
|---|
| ArgC ESI |
|
|---|
| LysN ESI |
|
|---|
| TryLysC ESI |
|
|---|
| Try MALDI |
|
|---|
| ChTry MALDI |
|
|---|
| ArgC MALDI |
|
|---|
| LysN MALDI |
|
|---|
| TryLysC MALDI |
|
|---|
| Try LTQ |
|
|---|
| ChTry LTQ |
|
|---|
| ArgC LTQ |
|
|---|
| LysN LTQ |
|
|---|
| TryLysC LTQ |
|
|---|
| Try MSlow |
|
|---|
| ChTry MSlow |
|
|---|
| ArgC MSlow |
|
|---|
| LysN MSlow |
|
|---|
| TryLysC MSlow |
|
|---|
| Try MShigh |
|
|---|
| ChTry MShigh |
|
|---|
| ArgC MShigh |
|
|---|
| LysN MShigh |
|
|---|
| TryLysC MShigh |
|
|---|
General Statistics
Number of major isoforms |
Number of additional isoforms |
Number of all proteins |
Number of amino acids |
Min. Seq. Length |
Max. Seq. Length |
Avg. Seq. Length |
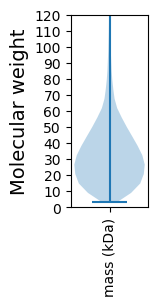
Avg. Mol. Weight |
|---|---|---|---|---|---|---|---|
0 |
1788902 |
26 |
5618 |
327.6 |
35.0 |
Amino acid frequency
Ala |
Cys |
Asp |
Glu |
Phe |
Gly |
His |
Ile |
Lys |
Leu |
|---|---|---|---|---|---|---|---|---|---|
14.326 ± 0.056 | 0.844 ± 0.009 |
5.79 ± 0.024 | 5.682 ± 0.036 |
2.702 ± 0.02 | 9.837 ± 0.037 |
2.364 ± 0.017 | 2.768 ± 0.024 |
2.043 ± 0.033 | 10.496 ± 0.038 |
Met |
Asn |
Gln |
Pro |
Arg |
Ser |
Thr |
Val |
Trp |
Tyr |
|---|---|---|---|---|---|---|---|---|---|
1.677 ± 0.013 | 1.586 ± 0.018 |
6.299 ± 0.034 | 2.377 ± 0.02 |
8.782 ± 0.041 | 4.582 ± 0.024 |
5.758 ± 0.024 | 8.597 ± 0.034 |
1.506 ± 0.013 | 1.985 ± 0.016 |
Most of the basic statistics you can see at this page can be downloaded from this CSV file
See this proteome in:

Proteome-pI is available under Creative Commons Attribution-NoDerivs license, for more details see here
| Reference: Kozlowski LP. Proteome-pI 2.0: Proteome Isoelectric Point Database Update. Nucleic Acids Res. 2021, doi: 10.1093/nar/gkab944 | Contact: Lukasz P. Kozlowski |