Lachnellula cervina
Taxonomy: cellular organisms; Eukaryota; Opisthokonta; Fungi; Dikarya; Ascomycota; saccharomyceta; Pezizomycotina; leotiomyceta; sordariomyceta; Leotiomycetes; Helotiales; Lachnaceae; Lachnellula
Average proteome isoelectric point is 6.46
Get precalculated fractions of proteins
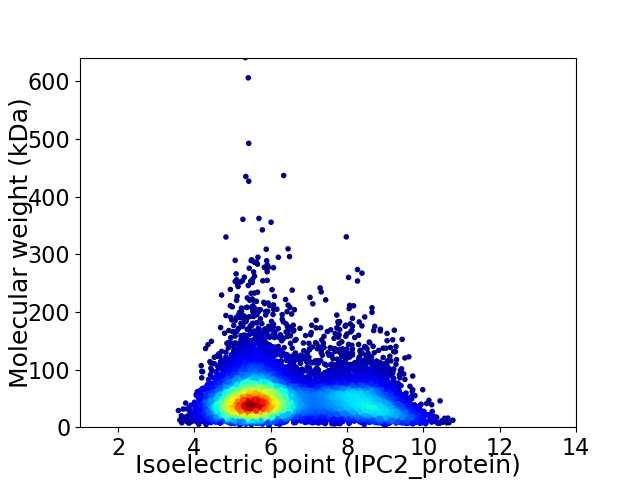
Virtual 2D-PAGE plot for 9411 proteins (isoelectric point calculated using IPC2_protein)
Get csv file with sequences according to given criteria:
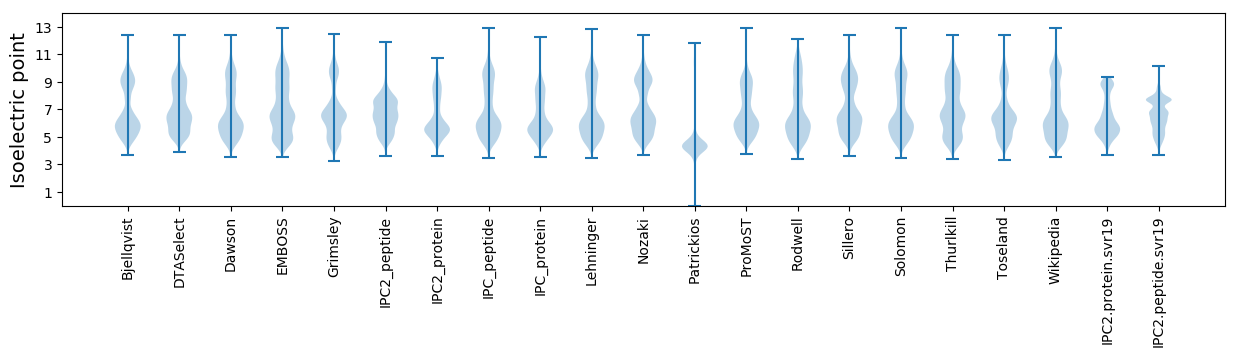
* You can choose from 21 different methods for calculating isoelectric point
Summary statistics related to proteome-wise predictions
Protein with the lowest isoelectric point:
>tr|A0A7D8UTW6|A0A7D8UTW6_9HELO GLC7-interacting protein 3 OS=Lachnellula cervina OX=1316786 GN=GIP3 PE=4 SV=1
MM1 pKa = 7.56PAANTTAKK9 pKa = 10.32GRR11 pKa = 11.84TATEE15 pKa = 3.71QSTATLTPAFSPPFSITSPDD35 pKa = 3.59ISSPWNDD42 pKa = 3.15FCQSGGPRR50 pKa = 11.84DD51 pKa = 4.08TEE53 pKa = 4.14DD54 pKa = 3.49SQIGTDD60 pKa = 3.44WDD62 pKa = 3.94CLHH65 pKa = 6.9FSTSEE70 pKa = 3.85MLEE73 pKa = 4.07GSSKK77 pKa = 9.54NTVPGIGEE85 pKa = 3.98DD86 pKa = 3.91TACAGLDD93 pKa = 3.4DD94 pKa = 5.2SLNPDD99 pKa = 3.57HH100 pKa = 7.23LLLTTLPWSDD110 pKa = 4.37YY111 pKa = 10.58PPQDD115 pKa = 2.98EE116 pKa = 5.11CLTSFSGPTTICEE129 pKa = 4.15QPDD132 pKa = 3.99PNVLARR138 pKa = 11.84VPIVDD143 pKa = 3.91PVANFTANIIMQMLCIGTVPQPLL166 pKa = 3.34
MM1 pKa = 7.56PAANTTAKK9 pKa = 10.32GRR11 pKa = 11.84TATEE15 pKa = 3.71QSTATLTPAFSPPFSITSPDD35 pKa = 3.59ISSPWNDD42 pKa = 3.15FCQSGGPRR50 pKa = 11.84DD51 pKa = 4.08TEE53 pKa = 4.14DD54 pKa = 3.49SQIGTDD60 pKa = 3.44WDD62 pKa = 3.94CLHH65 pKa = 6.9FSTSEE70 pKa = 3.85MLEE73 pKa = 4.07GSSKK77 pKa = 9.54NTVPGIGEE85 pKa = 3.98DD86 pKa = 3.91TACAGLDD93 pKa = 3.4DD94 pKa = 5.2SLNPDD99 pKa = 3.57HH100 pKa = 7.23LLLTTLPWSDD110 pKa = 4.37YY111 pKa = 10.58PPQDD115 pKa = 2.98EE116 pKa = 5.11CLTSFSGPTTICEE129 pKa = 4.15QPDD132 pKa = 3.99PNVLARR138 pKa = 11.84VPIVDD143 pKa = 3.91PVANFTANIIMQMLCIGTVPQPLL166 pKa = 3.34
Molecular weight: 17.67 kDa
Isoelectric point according different methods:
Protein with the highest isoelectric point:
>tr|A0A7D8YJR0|A0A7D8YJR0_9HELO Ubiquitin-like domain-containing protein OS=Lachnellula cervina OX=1316786 GN=LCER1_G008191 PE=4 SV=1
RR1 pKa = 7.41KK2 pKa = 9.28AQLRR6 pKa = 11.84LLHH9 pKa = 6.57CCTAALHH16 pKa = 5.84AHH18 pKa = 6.14PAKK21 pKa = 10.58DD22 pKa = 3.13IRR24 pKa = 11.84SRR26 pKa = 11.84RR27 pKa = 11.84HH28 pKa = 4.21WRR30 pKa = 11.84IKK32 pKa = 9.28PHH34 pKa = 6.15VDD36 pKa = 3.0YY37 pKa = 10.91GLCTILFQDD46 pKa = 3.28QVGGLEE52 pKa = 3.96VDD54 pKa = 3.77PDD56 pKa = 3.72HH57 pKa = 6.77TGKK60 pKa = 10.57FLPATLARR68 pKa = 11.84GTCVINVADD77 pKa = 4.43LLQRR81 pKa = 11.84LSNNRR86 pKa = 11.84LKK88 pKa = 9.95STRR91 pKa = 11.84HH92 pKa = 5.28RR93 pKa = 11.84VTPPQLIEE101 pKa = 3.98EE102 pKa = 4.64QKK104 pKa = 9.52RR105 pKa = 11.84TLGPEE110 pKa = 3.99DD111 pKa = 4.3YY112 pKa = 11.16LPARR116 pKa = 11.84YY117 pKa = 8.16STAFFVHH124 pKa = 7.02PAPSHH129 pKa = 4.73TVAPILLPGDD139 pKa = 3.79PASEE143 pKa = 4.13SEE145 pKa = 4.26PVNVRR150 pKa = 11.84SGEE153 pKa = 4.08RR154 pKa = 11.84VSQGGITRR162 pKa = 11.84RR163 pKa = 11.84LICRR167 pKa = 11.84TRR169 pKa = 11.84RR170 pKa = 11.84FKK172 pKa = 10.54MRR174 pKa = 11.84GRR176 pKa = 11.84RR177 pKa = 11.84LTARR181 pKa = 11.84PKK183 pKa = 10.19LYY185 pKa = 10.56RR186 pKa = 11.84SVLCNDD192 pKa = 4.43TIDD195 pKa = 3.4VV196 pKa = 3.8
RR1 pKa = 7.41KK2 pKa = 9.28AQLRR6 pKa = 11.84LLHH9 pKa = 6.57CCTAALHH16 pKa = 5.84AHH18 pKa = 6.14PAKK21 pKa = 10.58DD22 pKa = 3.13IRR24 pKa = 11.84SRR26 pKa = 11.84RR27 pKa = 11.84HH28 pKa = 4.21WRR30 pKa = 11.84IKK32 pKa = 9.28PHH34 pKa = 6.15VDD36 pKa = 3.0YY37 pKa = 10.91GLCTILFQDD46 pKa = 3.28QVGGLEE52 pKa = 3.96VDD54 pKa = 3.77PDD56 pKa = 3.72HH57 pKa = 6.77TGKK60 pKa = 10.57FLPATLARR68 pKa = 11.84GTCVINVADD77 pKa = 4.43LLQRR81 pKa = 11.84LSNNRR86 pKa = 11.84LKK88 pKa = 9.95STRR91 pKa = 11.84HH92 pKa = 5.28RR93 pKa = 11.84VTPPQLIEE101 pKa = 3.98EE102 pKa = 4.64QKK104 pKa = 9.52RR105 pKa = 11.84TLGPEE110 pKa = 3.99DD111 pKa = 4.3YY112 pKa = 11.16LPARR116 pKa = 11.84YY117 pKa = 8.16STAFFVHH124 pKa = 7.02PAPSHH129 pKa = 4.73TVAPILLPGDD139 pKa = 3.79PASEE143 pKa = 4.13SEE145 pKa = 4.26PVNVRR150 pKa = 11.84SGEE153 pKa = 4.08RR154 pKa = 11.84VSQGGITRR162 pKa = 11.84RR163 pKa = 11.84LICRR167 pKa = 11.84TRR169 pKa = 11.84RR170 pKa = 11.84FKK172 pKa = 10.54MRR174 pKa = 11.84GRR176 pKa = 11.84RR177 pKa = 11.84LTARR181 pKa = 11.84PKK183 pKa = 10.19LYY185 pKa = 10.56RR186 pKa = 11.84SVLCNDD192 pKa = 4.43TIDD195 pKa = 3.4VV196 pKa = 3.8
Molecular weight: 22.19 kDa
Isoelectric point according different methods:
Peptides (in silico digests for buttom-up proteomics)
Below you can find in silico digests of the whole proteome with Trypsin, Chymotrypsin, Trypsin+LysC, LysN, ArgC proteases suitable for different mass spec machines.| Try ESI |
 |
|---|
| ChTry ESI |
|
|---|
| ArgC ESI |
|
|---|
| LysN ESI |
|
|---|
| TryLysC ESI |
|
|---|
| Try MALDI |
|
|---|
| ChTry MALDI |
|
|---|
| ArgC MALDI |
|
|---|
| LysN MALDI |
|
|---|
| TryLysC MALDI |
|
|---|
| Try LTQ |
|
|---|
| ChTry LTQ |
|
|---|
| ArgC LTQ |
|
|---|
| LysN LTQ |
|
|---|
| TryLysC LTQ |
|
|---|
| Try MSlow |
|
|---|
| ChTry MSlow |
|
|---|
| ArgC MSlow |
|
|---|
| LysN MSlow |
|
|---|
| TryLysC MSlow |
|
|---|
| Try MShigh |
|
|---|
| ChTry MShigh |
|
|---|
| ArgC MShigh |
|
|---|
| LysN MShigh |
|
|---|
| TryLysC MShigh |
|
|---|
General Statistics
Number of major isoforms |
Number of additional isoforms |
Number of all proteins |
Number of amino acids |
Min. Seq. Length |
Max. Seq. Length |
Avg. Seq. Length |
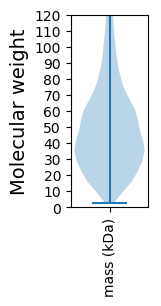
Avg. Mol. Weight |
|---|---|---|---|---|---|---|---|
0 |
4670120 |
25 |
5789 |
496.2 |
54.81 |
Amino acid frequency
Ala |
Cys |
Asp |
Glu |
Phe |
Gly |
His |
Ile |
Lys |
Leu |
|---|---|---|---|---|---|---|---|---|---|
8.416 ± 0.022 | 1.128 ± 0.009 |
5.51 ± 0.015 | 6.224 ± 0.023 |
3.845 ± 0.015 | 7.122 ± 0.02 |
2.251 ± 0.011 | 5.227 ± 0.015 |
5.299 ± 0.024 | 8.888 ± 0.023 |
Met |
Asn |
Gln |
Pro |
Arg |
Ser |
Thr |
Val |
Trp |
Tyr |
|---|---|---|---|---|---|---|---|---|---|
2.192 ± 0.009 | 3.884 ± 0.013 |
5.861 ± 0.023 | 3.838 ± 0.016 |
5.596 ± 0.021 | 8.37 ± 0.027 |
6.035 ± 0.018 | 6.079 ± 0.015 |
1.424 ± 0.008 | 2.811 ± 0.012 |
Most of the basic statistics you can see at this page can be downloaded from this CSV file
See this proteome in:

Proteome-pI is available under Creative Commons Attribution-NoDerivs license, for more details see here
| Reference: Kozlowski LP. Proteome-pI 2.0: Proteome Isoelectric Point Database Update. Nucleic Acids Res. 2021, doi: 10.1093/nar/gkab944 | Contact: Lukasz P. Kozlowski |