Lactobacillus virus LLKu
Taxonomy: Viruses; Duplodnaviria; Heunggongvirae; Uroviricota; Caudoviricetes; Caudovirales; Siphoviridae; Cequinquevirus
Average proteome isoelectric point is 6.42
Get precalculated fractions of proteins
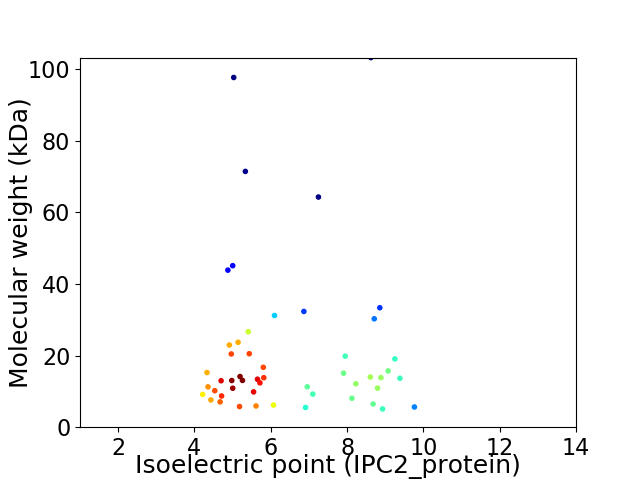
Virtual 2D-PAGE plot for 51 proteins (isoelectric point calculated using IPC2_protein)
Get csv file with sequences according to given criteria:
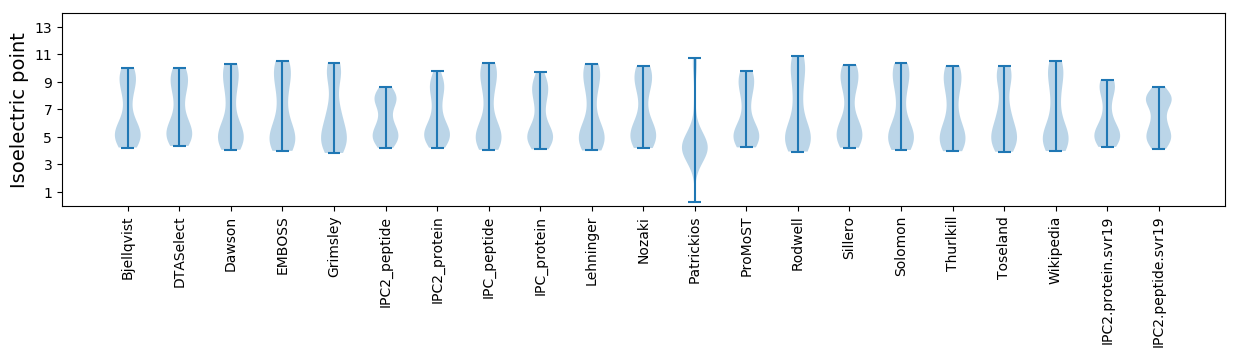
* You can choose from 21 different methods for calculating isoelectric point
Summary statistics related to proteome-wise predictions
Protein with the lowest isoelectric point:
>tr|F7V9E2|F7V9E2_9CAUD Uncharacterized protein OS=Lactobacillus virus LLKu OX=297254 PE=4 SV=1
MM1 pKa = 7.29KK2 pKa = 10.35VISFNEE8 pKa = 4.21CNRR11 pKa = 11.84GSAYY15 pKa = 9.86TYY17 pKa = 10.42IGFTNSSITGDD28 pKa = 3.43EE29 pKa = 4.35DD30 pKa = 4.59YY31 pKa = 9.96EE32 pKa = 4.56TVINRR37 pKa = 11.84LVSATKK43 pKa = 10.63YY44 pKa = 8.52MQLHH48 pKa = 6.2SGGAPVLIAGDD59 pKa = 3.63KK60 pKa = 10.45VEE62 pKa = 4.26VVGDD66 pKa = 4.2LEE68 pKa = 5.65DD69 pKa = 3.56EE70 pKa = 4.32
MM1 pKa = 7.29KK2 pKa = 10.35VISFNEE8 pKa = 4.21CNRR11 pKa = 11.84GSAYY15 pKa = 9.86TYY17 pKa = 10.42IGFTNSSITGDD28 pKa = 3.43EE29 pKa = 4.35DD30 pKa = 4.59YY31 pKa = 9.96EE32 pKa = 4.56TVINRR37 pKa = 11.84LVSATKK43 pKa = 10.63YY44 pKa = 8.52MQLHH48 pKa = 6.2SGGAPVLIAGDD59 pKa = 3.63KK60 pKa = 10.45VEE62 pKa = 4.26VVGDD66 pKa = 4.2LEE68 pKa = 5.65DD69 pKa = 3.56EE70 pKa = 4.32
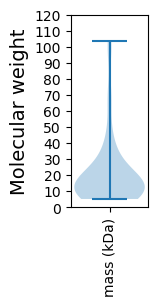
Molecular weight: 7.62 kDa
Isoelectric point according different methods:
Protein with the highest isoelectric point:
>tr|F7V9A4|F7V9A4_9CAUD Putative portal protein OS=Lactobacillus virus LLKu OX=297254 PE=4 SV=1
MM1 pKa = 7.32NSEE4 pKa = 3.87NYY6 pKa = 9.47KK7 pKa = 10.07VYY9 pKa = 11.0KK10 pKa = 9.22HH11 pKa = 5.26TTPNNKK17 pKa = 9.35VYY19 pKa = 10.57IGITKK24 pKa = 10.27LDD26 pKa = 3.52VNKK29 pKa = 10.17RR30 pKa = 11.84WKK32 pKa = 10.28NGNGYY37 pKa = 9.33KK38 pKa = 10.14HH39 pKa = 5.82NQYY42 pKa = 8.26FTRR45 pKa = 11.84AII47 pKa = 3.61
MM1 pKa = 7.32NSEE4 pKa = 3.87NYY6 pKa = 9.47KK7 pKa = 10.07VYY9 pKa = 11.0KK10 pKa = 9.22HH11 pKa = 5.26TTPNNKK17 pKa = 9.35VYY19 pKa = 10.57IGITKK24 pKa = 10.27LDD26 pKa = 3.52VNKK29 pKa = 10.17RR30 pKa = 11.84WKK32 pKa = 10.28NGNGYY37 pKa = 9.33KK38 pKa = 10.14HH39 pKa = 5.82NQYY42 pKa = 8.26FTRR45 pKa = 11.84AII47 pKa = 3.61
Molecular weight: 5.65 kDa
Isoelectric point according different methods:
Peptides (in silico digests for buttom-up proteomics)
Below you can find in silico digests of the whole proteome with Trypsin, Chymotrypsin, Trypsin+LysC, LysN, ArgC proteases suitable for different mass spec machines.| Try ESI |
 |
|---|
| ChTry ESI |
|
|---|
| ArgC ESI |
|
|---|
| LysN ESI |
|
|---|
| TryLysC ESI |
|
|---|
| Try MALDI |
|
|---|
| ChTry MALDI |
|
|---|
| ArgC MALDI |
|
|---|
| LysN MALDI |
|
|---|
| TryLysC MALDI |
|
|---|
| Try LTQ |
|
|---|
| ChTry LTQ |
|
|---|
| ArgC LTQ |
|
|---|
| LysN LTQ |
|
|---|
| TryLysC LTQ |
|
|---|
| Try MSlow |
|
|---|
| ChTry MSlow |
|
|---|
| ArgC MSlow |
|
|---|
| LysN MSlow |
|
|---|
| TryLysC MSlow |
|
|---|
| Try MShigh |
|
|---|
| ChTry MShigh |
|
|---|
| ArgC MShigh |
|
|---|
| LysN MShigh |
|
|---|
| TryLysC MShigh |
|
|---|
General Statistics
Number of major isoforms |
Number of additional isoforms |
Number of all proteins |
Number of amino acids |
Min. Seq. Length |
Max. Seq. Length |
Avg. Seq. Length |
Avg. Mol. Weight |
|---|---|---|---|---|---|---|---|
0 |
9498 |
44 |
968 |
186.2 |
21.0 |
Amino acid frequency
Ala |
Cys |
Asp |
Glu |
Phe |
Gly |
His |
Ile |
Lys |
Leu |
|---|---|---|---|---|---|---|---|---|---|
6.538 ± 0.525 | 0.979 ± 0.175 |
6.422 ± 0.359 | 6.875 ± 0.54 |
3.864 ± 0.206 | 6.686 ± 0.378 |
1.39 ± 0.175 | 6.865 ± 0.309 |
8.475 ± 0.466 | 7.654 ± 0.283 |
Met |
Asn |
Gln |
Pro |
Arg |
Ser |
Thr |
Val |
Trp |
Tyr |
|---|---|---|---|---|---|---|---|---|---|
2.537 ± 0.205 | 6.728 ± 0.328 |
2.453 ± 0.172 | 3.39 ± 0.257 |
4.18 ± 0.298 | 6.58 ± 0.343 |
5.97 ± 0.309 | 7.023 ± 0.173 |
1.021 ± 0.125 | 4.369 ± 0.317 |
Most of the basic statistics you can see at this page can be downloaded from this CSV file
See this proteome in:

Proteome-pI is available under Creative Commons Attribution-NoDerivs license, for more details see here
| Reference: Kozlowski LP. Proteome-pI 2.0: Proteome Isoelectric Point Database Update. Nucleic Acids Res. 2021, doi: 10.1093/nar/gkab944 | Contact: Lukasz P. Kozlowski |