Wenxinia saemankumensis
Taxonomy: cellular organisms; Bacteria; Proteobacteria; Alphaproteobacteria; Rhodobacterales; Roseobacteraceae; Wenxinia
Average proteome isoelectric point is 6.21
Get precalculated fractions of proteins
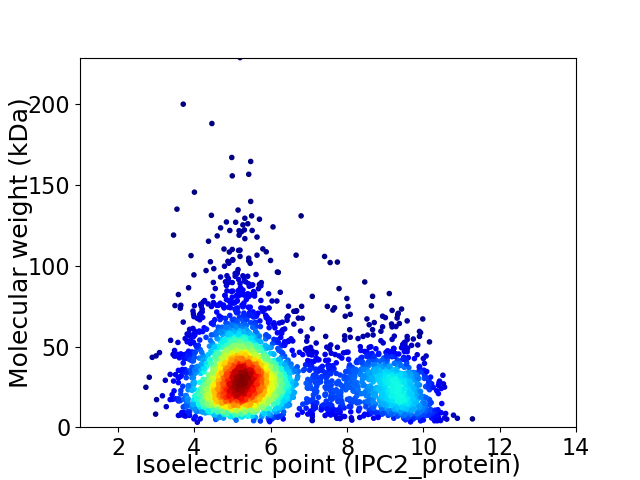
Virtual 2D-PAGE plot for 3386 proteins (isoelectric point calculated using IPC2_protein)
Get csv file with sequences according to given criteria:
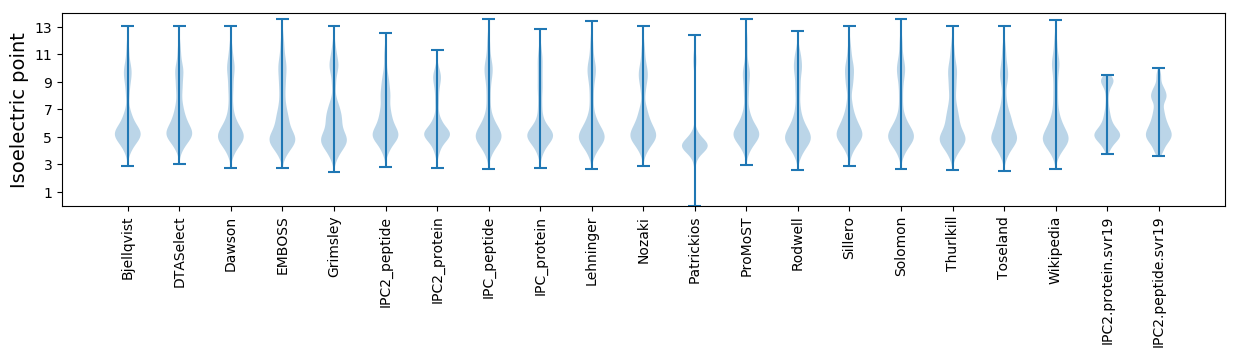
* You can choose from 21 different methods for calculating isoelectric point
Summary statistics related to proteome-wise predictions
Protein with the lowest isoelectric point:
>tr|A0A1M6A3K7|A0A1M6A3K7_9RHOB Peptide/nickel transport system permease protein OS=Wenxinia saemankumensis OX=1447782 GN=SAMN05444417_0183 PE=3 SV=1
MM1 pKa = 7.63KK2 pKa = 10.53KK3 pKa = 10.38LLLSSALTLLAAPALAQDD21 pKa = 4.74GEE23 pKa = 4.53CGEE26 pKa = 4.23VSITEE31 pKa = 4.25MNWASASVVTNVASFILTQGYY52 pKa = 8.92GCDD55 pKa = 3.59VSIVPSDD62 pKa = 3.71TVPAITSVSEE72 pKa = 3.85NGEE75 pKa = 3.85PDD77 pKa = 3.08IVTEE81 pKa = 4.49LWTNATGQVYY91 pKa = 10.34EE92 pKa = 4.14EE93 pKa = 4.51MKK95 pKa = 10.82DD96 pKa = 3.08AGTIQEE102 pKa = 4.55LGAVLEE108 pKa = 4.68PGGIDD113 pKa = 3.37AWWIPAYY120 pKa = 10.25LAEE123 pKa = 4.47AHH125 pKa = 6.96PEE127 pKa = 3.78LTTIEE132 pKa = 4.29GVLANPDD139 pKa = 3.37LVGGRR144 pKa = 11.84FHH146 pKa = 7.13NCPEE150 pKa = 3.77GWGCRR155 pKa = 11.84VFNDD159 pKa = 3.29NLLPAFGVEE168 pKa = 3.93EE169 pKa = 4.09AGIEE173 pKa = 4.12IFDD176 pKa = 4.18HH177 pKa = 7.12GSGEE181 pKa = 4.23TLATSIASAFEE192 pKa = 4.23NEE194 pKa = 4.51EE195 pKa = 3.93PWFGYY200 pKa = 9.3YY201 pKa = 8.43WAPTSVIGRR210 pKa = 11.84YY211 pKa = 10.55DD212 pKa = 3.46MVQVDD217 pKa = 3.4MGDD220 pKa = 3.76YY221 pKa = 10.74DD222 pKa = 4.62RR223 pKa = 11.84EE224 pKa = 4.25AHH226 pKa = 6.35EE227 pKa = 4.45AAQNVDD233 pKa = 3.05ATDD236 pKa = 3.3VGRR239 pKa = 11.84TSFPPAPVATAVTTDD254 pKa = 3.55FAEE257 pKa = 4.28AHH259 pKa = 6.58PEE261 pKa = 3.92LVDD264 pKa = 3.8FLSNMTFQTDD274 pKa = 3.28TMNSILSWMEE284 pKa = 3.27EE285 pKa = 3.71NAASGEE291 pKa = 4.06EE292 pKa = 4.44GAVHH296 pKa = 7.41FLTTYY301 pKa = 8.58QDD303 pKa = 3.14EE304 pKa = 4.29WRR306 pKa = 11.84GWISGEE312 pKa = 3.8ARR314 pKa = 11.84EE315 pKa = 4.61NLSAMLQQQ323 pKa = 4.01
MM1 pKa = 7.63KK2 pKa = 10.53KK3 pKa = 10.38LLLSSALTLLAAPALAQDD21 pKa = 4.74GEE23 pKa = 4.53CGEE26 pKa = 4.23VSITEE31 pKa = 4.25MNWASASVVTNVASFILTQGYY52 pKa = 8.92GCDD55 pKa = 3.59VSIVPSDD62 pKa = 3.71TVPAITSVSEE72 pKa = 3.85NGEE75 pKa = 3.85PDD77 pKa = 3.08IVTEE81 pKa = 4.49LWTNATGQVYY91 pKa = 10.34EE92 pKa = 4.14EE93 pKa = 4.51MKK95 pKa = 10.82DD96 pKa = 3.08AGTIQEE102 pKa = 4.55LGAVLEE108 pKa = 4.68PGGIDD113 pKa = 3.37AWWIPAYY120 pKa = 10.25LAEE123 pKa = 4.47AHH125 pKa = 6.96PEE127 pKa = 3.78LTTIEE132 pKa = 4.29GVLANPDD139 pKa = 3.37LVGGRR144 pKa = 11.84FHH146 pKa = 7.13NCPEE150 pKa = 3.77GWGCRR155 pKa = 11.84VFNDD159 pKa = 3.29NLLPAFGVEE168 pKa = 3.93EE169 pKa = 4.09AGIEE173 pKa = 4.12IFDD176 pKa = 4.18HH177 pKa = 7.12GSGEE181 pKa = 4.23TLATSIASAFEE192 pKa = 4.23NEE194 pKa = 4.51EE195 pKa = 3.93PWFGYY200 pKa = 9.3YY201 pKa = 8.43WAPTSVIGRR210 pKa = 11.84YY211 pKa = 10.55DD212 pKa = 3.46MVQVDD217 pKa = 3.4MGDD220 pKa = 3.76YY221 pKa = 10.74DD222 pKa = 4.62RR223 pKa = 11.84EE224 pKa = 4.25AHH226 pKa = 6.35EE227 pKa = 4.45AAQNVDD233 pKa = 3.05ATDD236 pKa = 3.3VGRR239 pKa = 11.84TSFPPAPVATAVTTDD254 pKa = 3.55FAEE257 pKa = 4.28AHH259 pKa = 6.58PEE261 pKa = 3.92LVDD264 pKa = 3.8FLSNMTFQTDD274 pKa = 3.28TMNSILSWMEE284 pKa = 3.27EE285 pKa = 3.71NAASGEE291 pKa = 4.06EE292 pKa = 4.44GAVHH296 pKa = 7.41FLTTYY301 pKa = 8.58QDD303 pKa = 3.14EE304 pKa = 4.29WRR306 pKa = 11.84GWISGEE312 pKa = 3.8ARR314 pKa = 11.84EE315 pKa = 4.61NLSAMLQQQ323 pKa = 4.01
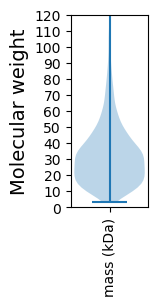
Molecular weight: 34.92 kDa
Isoelectric point according different methods:
Protein with the highest isoelectric point:
>tr|A0A1M6E9S4|A0A1M6E9S4_9RHOB 4-diphosphocytidyl-2-C-methyl-D-erythritol kinase OS=Wenxinia saemankumensis OX=1447782 GN=ispE PE=3 SV=1
MM1 pKa = 7.45KK2 pKa = 9.61RR3 pKa = 11.84TFQPSNRR10 pKa = 11.84VRR12 pKa = 11.84KK13 pKa = 9.2ARR15 pKa = 11.84HH16 pKa = 4.71GFRR19 pKa = 11.84ARR21 pKa = 11.84MATKK25 pKa = 10.25SGRR28 pKa = 11.84QIIAARR34 pKa = 11.84RR35 pKa = 11.84SRR37 pKa = 11.84GRR39 pKa = 11.84KK40 pKa = 8.96RR41 pKa = 11.84LSAA44 pKa = 4.03
MM1 pKa = 7.45KK2 pKa = 9.61RR3 pKa = 11.84TFQPSNRR10 pKa = 11.84VRR12 pKa = 11.84KK13 pKa = 9.2ARR15 pKa = 11.84HH16 pKa = 4.71GFRR19 pKa = 11.84ARR21 pKa = 11.84MATKK25 pKa = 10.25SGRR28 pKa = 11.84QIIAARR34 pKa = 11.84RR35 pKa = 11.84SRR37 pKa = 11.84GRR39 pKa = 11.84KK40 pKa = 8.96RR41 pKa = 11.84LSAA44 pKa = 4.03
Molecular weight: 5.15 kDa
Isoelectric point according different methods:
Peptides (in silico digests for buttom-up proteomics)
Below you can find in silico digests of the whole proteome with Trypsin, Chymotrypsin, Trypsin+LysC, LysN, ArgC proteases suitable for different mass spec machines.| Try ESI |
 |
|---|
| ChTry ESI |
|
|---|
| ArgC ESI |
|
|---|
| LysN ESI |
|
|---|
| TryLysC ESI |
|
|---|
| Try MALDI |
|
|---|
| ChTry MALDI |
|
|---|
| ArgC MALDI |
|
|---|
| LysN MALDI |
|
|---|
| TryLysC MALDI |
|
|---|
| Try LTQ |
|
|---|
| ChTry LTQ |
|
|---|
| ArgC LTQ |
|
|---|
| LysN LTQ |
|
|---|
| TryLysC LTQ |
|
|---|
| Try MSlow |
|
|---|
| ChTry MSlow |
|
|---|
| ArgC MSlow |
|
|---|
| LysN MSlow |
|
|---|
| TryLysC MSlow |
|
|---|
| Try MShigh |
|
|---|
| ChTry MShigh |
|
|---|
| ArgC MShigh |
|
|---|
| LysN MShigh |
|
|---|
| TryLysC MShigh |
|
|---|
General Statistics
Number of major isoforms |
Number of additional isoforms |
Number of all proteins |
Number of amino acids |
Min. Seq. Length |
Max. Seq. Length |
Avg. Seq. Length |
Avg. Mol. Weight |
|---|---|---|---|---|---|---|---|
0 |
1058228 |
29 |
2118 |
312.5 |
33.6 |
Amino acid frequency
Ala |
Cys |
Asp |
Glu |
Phe |
Gly |
His |
Ile |
Lys |
Leu |
|---|---|---|---|---|---|---|---|---|---|
13.892 ± 0.069 | 0.787 ± 0.013 |
6.143 ± 0.035 | 6.123 ± 0.039 |
3.346 ± 0.026 | 9.661 ± 0.049 |
1.928 ± 0.021 | 4.615 ± 0.031 |
1.963 ± 0.038 | 10.156 ± 0.051 |
Met |
Asn |
Gln |
Pro |
Arg |
Ser |
Thr |
Val |
Trp |
Tyr |
|---|---|---|---|---|---|---|---|---|---|
2.518 ± 0.02 | 1.945 ± 0.022 |
5.814 ± 0.042 | 2.626 ± 0.027 |
7.983 ± 0.046 | 4.505 ± 0.023 |
5.246 ± 0.031 | 7.244 ± 0.032 |
1.506 ± 0.019 | 2.0 ± 0.021 |
Most of the basic statistics you can see at this page can be downloaded from this CSV file
See this proteome in:

Proteome-pI is available under Creative Commons Attribution-NoDerivs license, for more details see here
| Reference: Kozlowski LP. Proteome-pI 2.0: Proteome Isoelectric Point Database Update. Nucleic Acids Res. 2021, doi: 10.1093/nar/gkab944 | Contact: Lukasz P. Kozlowski |