Rhodobacter sp. SGA-6-6
Taxonomy: cellular organisms; Bacteria; Proteobacteria; Alphaproteobacteria; Rhodobacterales; Rhodobacteraceae; Rhodobacter; unclassified Rhodobacter
Average proteome isoelectric point is 6.48
Get precalculated fractions of proteins
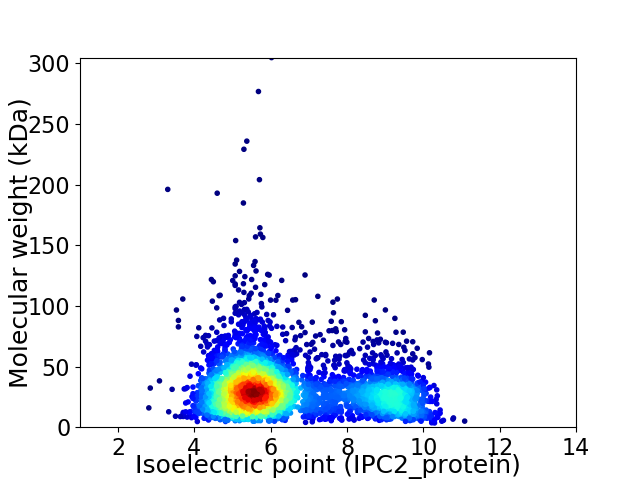
Virtual 2D-PAGE plot for 4072 proteins (isoelectric point calculated using IPC2_protein)
Get csv file with sequences according to given criteria:
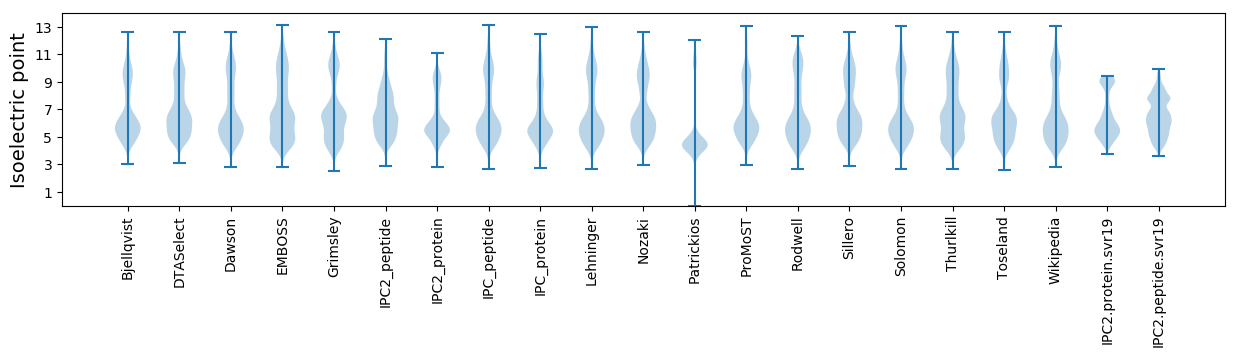
* You can choose from 21 different methods for calculating isoelectric point
Summary statistics related to proteome-wise predictions
Protein with the lowest isoelectric point:
>tr|A0A6M1MI08|A0A6M1MI08_9RHOB YciI family protein OS=Rhodobacter sp. SGA-6-6 OX=2710882 GN=G5B31_02870 PE=3 SV=1
MM1 pKa = 8.07RR2 pKa = 11.84ILALTSACLLAFSTPVLADD21 pKa = 3.44PAVGLGLSFSFGGGQSQTGIGLRR44 pKa = 11.84VFSDD48 pKa = 3.79DD49 pKa = 4.66EE50 pKa = 4.39EE51 pKa = 5.97DD52 pKa = 3.97SFAASAGLDD61 pKa = 3.56YY62 pKa = 11.08IFGSGAWRR70 pKa = 11.84GTVGGAYY77 pKa = 10.39LGDD80 pKa = 3.58NSYY83 pKa = 11.55VGLDD87 pKa = 3.04VGLNFNGGGVNYY99 pKa = 9.74GISAGAVNTEE109 pKa = 4.44DD110 pKa = 3.33KK111 pKa = 10.68AAPAVTPPPGPPPVV125 pKa = 3.38
MM1 pKa = 8.07RR2 pKa = 11.84ILALTSACLLAFSTPVLADD21 pKa = 3.44PAVGLGLSFSFGGGQSQTGIGLRR44 pKa = 11.84VFSDD48 pKa = 3.79DD49 pKa = 4.66EE50 pKa = 4.39EE51 pKa = 5.97DD52 pKa = 3.97SFAASAGLDD61 pKa = 3.56YY62 pKa = 11.08IFGSGAWRR70 pKa = 11.84GTVGGAYY77 pKa = 10.39LGDD80 pKa = 3.58NSYY83 pKa = 11.55VGLDD87 pKa = 3.04VGLNFNGGGVNYY99 pKa = 9.74GISAGAVNTEE109 pKa = 4.44DD110 pKa = 3.33KK111 pKa = 10.68AAPAVTPPPGPPPVV125 pKa = 3.38
Molecular weight: 12.41 kDa
Isoelectric point according different methods:
Protein with the highest isoelectric point:
>tr|A0A6M1MGW4|A0A6M1MGW4_9RHOB HutD family protein OS=Rhodobacter sp. SGA-6-6 OX=2710882 GN=G5B31_00995 PE=4 SV=1
MM1 pKa = 7.35KK2 pKa = 9.43RR3 pKa = 11.84TYY5 pKa = 10.27QPSKK9 pKa = 9.26LVRR12 pKa = 11.84SRR14 pKa = 11.84RR15 pKa = 11.84HH16 pKa = 4.43GFRR19 pKa = 11.84ARR21 pKa = 11.84MATKK25 pKa = 10.34GGRR28 pKa = 11.84LVLAARR34 pKa = 11.84RR35 pKa = 11.84AKK37 pKa = 9.71GRR39 pKa = 11.84KK40 pKa = 8.73VLSAA44 pKa = 4.05
MM1 pKa = 7.35KK2 pKa = 9.43RR3 pKa = 11.84TYY5 pKa = 10.27QPSKK9 pKa = 9.26LVRR12 pKa = 11.84SRR14 pKa = 11.84RR15 pKa = 11.84HH16 pKa = 4.43GFRR19 pKa = 11.84ARR21 pKa = 11.84MATKK25 pKa = 10.34GGRR28 pKa = 11.84LVLAARR34 pKa = 11.84RR35 pKa = 11.84AKK37 pKa = 9.71GRR39 pKa = 11.84KK40 pKa = 8.73VLSAA44 pKa = 4.05
Molecular weight: 5.02 kDa
Isoelectric point according different methods:
Peptides (in silico digests for buttom-up proteomics)
Below you can find in silico digests of the whole proteome with Trypsin, Chymotrypsin, Trypsin+LysC, LysN, ArgC proteases suitable for different mass spec machines.| Try ESI |
 |
|---|
| ChTry ESI |
|
|---|
| ArgC ESI |
|
|---|
| LysN ESI |
|
|---|
| TryLysC ESI |
|
|---|
| Try MALDI |
|
|---|
| ChTry MALDI |
|
|---|
| ArgC MALDI |
|
|---|
| LysN MALDI |
|
|---|
| TryLysC MALDI |
|
|---|
| Try LTQ |
|
|---|
| ChTry LTQ |
|
|---|
| ArgC LTQ |
|
|---|
| LysN LTQ |
|
|---|
| TryLysC LTQ |
|
|---|
| Try MSlow |
|
|---|
| ChTry MSlow |
|
|---|
| ArgC MSlow |
|
|---|
| LysN MSlow |
|
|---|
| TryLysC MSlow |
|
|---|
| Try MShigh |
|
|---|
| ChTry MShigh |
|
|---|
| ArgC MShigh |
|
|---|
| LysN MShigh |
|
|---|
| TryLysC MShigh |
|
|---|
General Statistics
Number of major isoforms |
Number of additional isoforms |
Number of all proteins |
Number of amino acids |
Min. Seq. Length |
Max. Seq. Length |
Avg. Seq. Length |
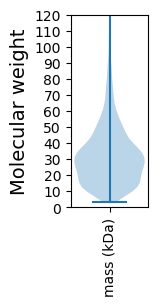
Avg. Mol. Weight |
|---|---|---|---|---|---|---|---|
0 |
1265259 |
33 |
2811 |
310.7 |
33.5 |
Amino acid frequency
Ala |
Cys |
Asp |
Glu |
Phe |
Gly |
His |
Ile |
Lys |
Leu |
|---|---|---|---|---|---|---|---|---|---|
13.842 ± 0.059 | 0.863 ± 0.011 |
5.489 ± 0.034 | 5.935 ± 0.039 |
3.544 ± 0.025 | 9.21 ± 0.048 |
1.997 ± 0.021 | 4.594 ± 0.027 |
2.772 ± 0.031 | 10.64 ± 0.045 |
Met |
Asn |
Gln |
Pro |
Arg |
Ser |
Thr |
Val |
Trp |
Tyr |
|---|---|---|---|---|---|---|---|---|---|
2.646 ± 0.016 | 2.105 ± 0.021 |
5.674 ± 0.028 | 2.903 ± 0.019 |
7.396 ± 0.048 | 4.515 ± 0.025 |
5.016 ± 0.022 | 7.32 ± 0.032 |
1.511 ± 0.017 | 2.028 ± 0.018 |
Most of the basic statistics you can see at this page can be downloaded from this CSV file
See this proteome in:

Proteome-pI is available under Creative Commons Attribution-NoDerivs license, for more details see here
| Reference: Kozlowski LP. Proteome-pI 2.0: Proteome Isoelectric Point Database Update. Nucleic Acids Res. 2021, doi: 10.1093/nar/gkab944 | Contact: Lukasz P. Kozlowski |