Geobacter sp. Red88
Taxonomy: cellular organisms; Bacteria; Proteobacteria; delta/epsilon subdivisions; Deltaproteobacteria; Desulfuromonadales; Geobacteraceae;
Average proteome isoelectric point is 6.67
Get precalculated fractions of proteins
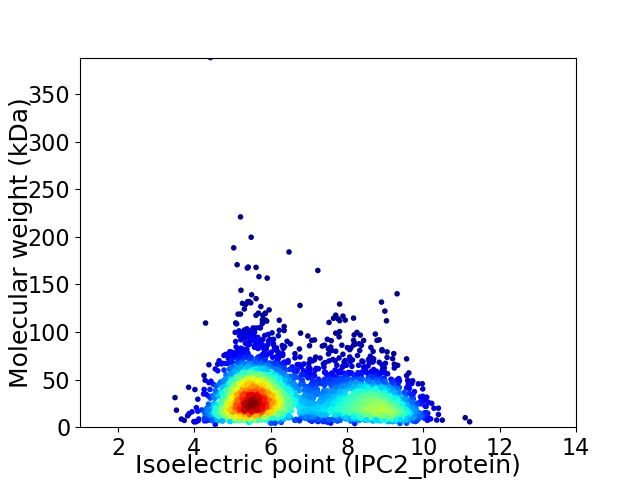
Virtual 2D-PAGE plot for 3510 proteins (isoelectric point calculated using IPC2_protein)
Get csv file with sequences according to given criteria:
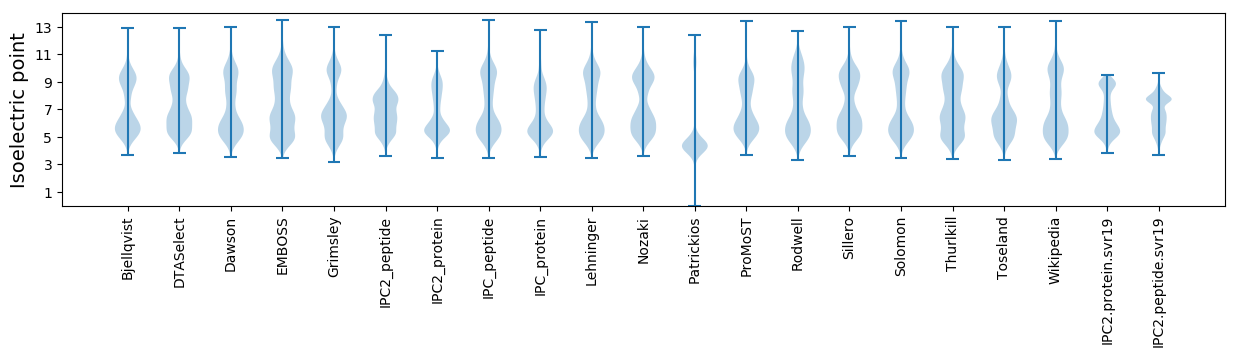
* You can choose from 21 different methods for calculating isoelectric point
Summary statistics related to proteome-wise predictions
Protein with the lowest isoelectric point:
>tr|A0A5A9XFR3|A0A5A9XFR3_9DELT NCS2 family permease OS=Geobacter sp. Red88 OX=2509454 GN=ET418_07535 PE=3 SV=1
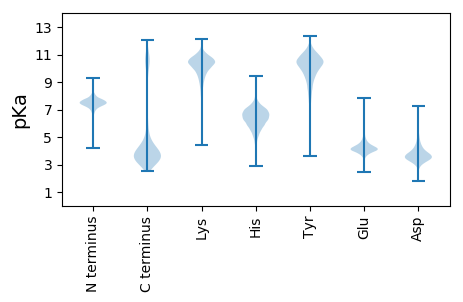
MM1 pKa = 7.32EE2 pKa = 5.12RR3 pKa = 11.84WICTICQYY11 pKa = 11.28VYY13 pKa = 11.06DD14 pKa = 4.95PATGDD19 pKa = 3.62PDD21 pKa = 4.01RR22 pKa = 11.84GVPPGTPFEE31 pKa = 4.48SLPDD35 pKa = 3.51DD36 pKa = 3.85WTCPLCGAGKK46 pKa = 10.06DD47 pKa = 3.71AFEE50 pKa = 5.15KK51 pKa = 10.55EE52 pKa = 4.16
MM1 pKa = 7.32EE2 pKa = 5.12RR3 pKa = 11.84WICTICQYY11 pKa = 11.28VYY13 pKa = 11.06DD14 pKa = 4.95PATGDD19 pKa = 3.62PDD21 pKa = 4.01RR22 pKa = 11.84GVPPGTPFEE31 pKa = 4.48SLPDD35 pKa = 3.51DD36 pKa = 3.85WTCPLCGAGKK46 pKa = 10.06DD47 pKa = 3.71AFEE50 pKa = 5.15KK51 pKa = 10.55EE52 pKa = 4.16
Molecular weight: 5.78 kDa
Isoelectric point according different methods:
Protein with the highest isoelectric point:
>tr|A0A5A9XDL5|A0A5A9XDL5_9DELT MerR family transcriptional regulator OS=Geobacter sp. Red88 OX=2509454 GN=ET418_12355 PE=4 SV=1
MM1 pKa = 7.45KK2 pKa = 9.61RR3 pKa = 11.84TFQPSNTSRR12 pKa = 11.84KK13 pKa = 7.49RR14 pKa = 11.84THH16 pKa = 6.16GFLVRR21 pKa = 11.84MSTKK25 pKa = 10.31NGRR28 pKa = 11.84LVIKK32 pKa = 10.39RR33 pKa = 11.84RR34 pKa = 11.84RR35 pKa = 11.84AKK37 pKa = 9.99GRR39 pKa = 11.84KK40 pKa = 8.27SLSVRR45 pKa = 11.84IAAKK49 pKa = 10.27
MM1 pKa = 7.45KK2 pKa = 9.61RR3 pKa = 11.84TFQPSNTSRR12 pKa = 11.84KK13 pKa = 7.49RR14 pKa = 11.84THH16 pKa = 6.16GFLVRR21 pKa = 11.84MSTKK25 pKa = 10.31NGRR28 pKa = 11.84LVIKK32 pKa = 10.39RR33 pKa = 11.84RR34 pKa = 11.84RR35 pKa = 11.84AKK37 pKa = 9.99GRR39 pKa = 11.84KK40 pKa = 8.27SLSVRR45 pKa = 11.84IAAKK49 pKa = 10.27
Molecular weight: 5.71 kDa
Isoelectric point according different methods:
Peptides (in silico digests for buttom-up proteomics)
Below you can find in silico digests of the whole proteome with Trypsin, Chymotrypsin, Trypsin+LysC, LysN, ArgC proteases suitable for different mass spec machines.| Try ESI |
 |
|---|
| ChTry ESI |
|
|---|
| ArgC ESI |
|
|---|
| LysN ESI |
|
|---|
| TryLysC ESI |
|
|---|
| Try MALDI |
|
|---|
| ChTry MALDI |
|
|---|
| ArgC MALDI |
|
|---|
| LysN MALDI |
|
|---|
| TryLysC MALDI |
|
|---|
| Try LTQ |
|
|---|
| ChTry LTQ |
|
|---|
| ArgC LTQ |
|
|---|
| LysN LTQ |
|
|---|
| TryLysC LTQ |
|
|---|
| Try MSlow |
|
|---|
| ChTry MSlow |
|
|---|
| ArgC MSlow |
|
|---|
| LysN MSlow |
|
|---|
| TryLysC MSlow |
|
|---|
| Try MShigh |
|
|---|
| ChTry MShigh |
|
|---|
| ArgC MShigh |
|
|---|
| LysN MShigh |
|
|---|
| TryLysC MShigh |
|
|---|
General Statistics
Number of major isoforms |
Number of additional isoforms |
Number of all proteins |
Number of amino acids |
Min. Seq. Length |
Max. Seq. Length |
Avg. Seq. Length |
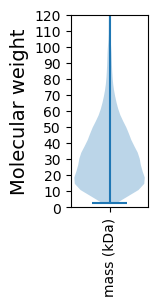
Avg. Mol. Weight |
|---|---|---|---|---|---|---|---|
0 |
1106654 |
28 |
3694 |
315.3 |
34.64 |
Amino acid frequency
Ala |
Cys |
Asp |
Glu |
Phe |
Gly |
His |
Ile |
Lys |
Leu |
|---|---|---|---|---|---|---|---|---|---|
9.996 ± 0.049 | 1.315 ± 0.019 |
5.176 ± 0.028 | 6.261 ± 0.047 |
3.969 ± 0.026 | 8.06 ± 0.037 |
2.11 ± 0.023 | 6.037 ± 0.032 |
4.783 ± 0.047 | 10.152 ± 0.047 |
Met |
Asn |
Gln |
Pro |
Arg |
Ser |
Thr |
Val |
Trp |
Tyr |
|---|---|---|---|---|---|---|---|---|---|
2.577 ± 0.018 | 3.293 ± 0.033 |
4.615 ± 0.03 | 3.257 ± 0.023 |
6.2 ± 0.049 | 5.705 ± 0.042 |
5.496 ± 0.049 | 7.245 ± 0.033 |
1.0 ± 0.015 | 2.752 ± 0.024 |
Most of the basic statistics you can see at this page can be downloaded from this CSV file
See this proteome in:

Proteome-pI is available under Creative Commons Attribution-NoDerivs license, for more details see here
| Reference: Kozlowski LP. Proteome-pI 2.0: Proteome Isoelectric Point Database Update. Nucleic Acids Res. 2021, doi: 10.1093/nar/gkab944 | Contact: Lukasz P. Kozlowski |