Miniopterus schreibersii polyomavirus 2
Taxonomy: Viruses; Monodnaviria; Shotokuvirae; Cossaviricota; Papovaviricetes; Sepolyvirales; Polyomaviridae; Alphapolyomavirus
Average proteome isoelectric point is 6.6
Get precalculated fractions of proteins
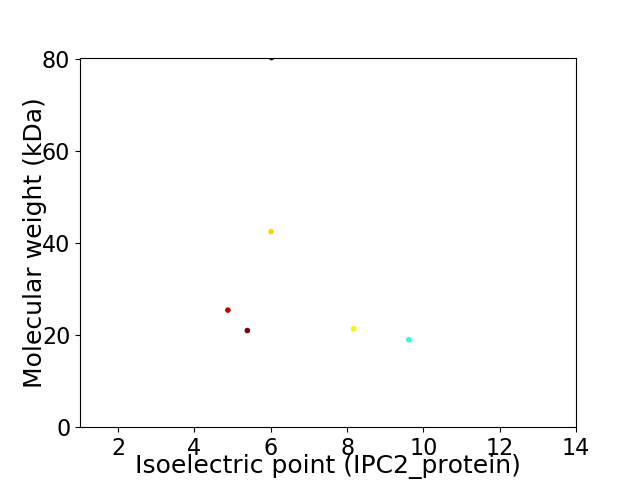
Virtual 2D-PAGE plot for 6 proteins (isoelectric point calculated using IPC2_protein)
Get csv file with sequences according to given criteria:
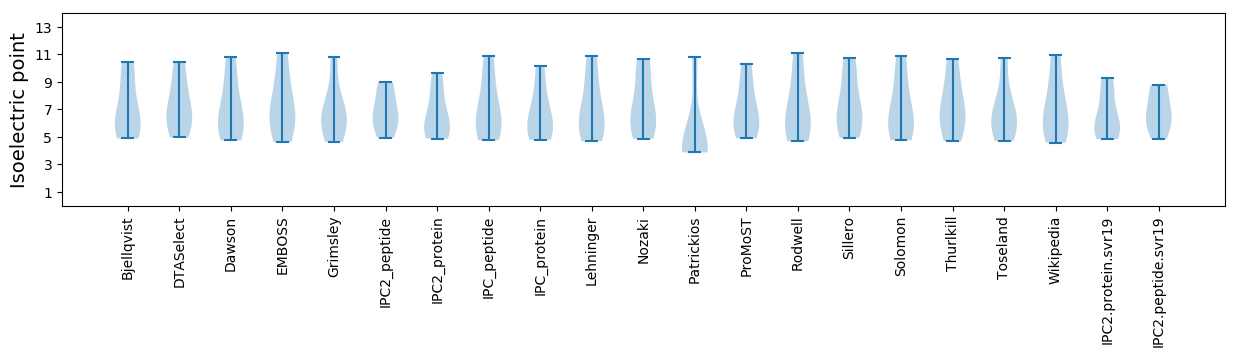
* You can choose from 21 different methods for calculating isoelectric point
Summary statistics related to proteome-wise predictions
Protein with the lowest isoelectric point:
>tr|A0A1S7J015|A0A1S7J015_9POLY Minor capsid protein VP2 OS=Miniopterus schreibersii polyomavirus 2 OX=1904409 PE=3 SV=1
MM1 pKa = 7.44GGVLSSVVEE10 pKa = 4.55MITMAVEE17 pKa = 3.9LSAATGISMDD27 pKa = 3.72ALLTGEE33 pKa = 4.68ALAALEE39 pKa = 4.57TEE41 pKa = 4.69VSSVMTIQGISSLEE55 pKa = 3.81ALAQLGWSAEE65 pKa = 4.17QFSNMAFISTSFTQAIGYY83 pKa = 9.53GVMFQTVTGISGLVQAGIRR102 pKa = 11.84LGFNVAAASRR112 pKa = 11.84RR113 pKa = 11.84VEE115 pKa = 3.95EE116 pKa = 4.32AQLEE120 pKa = 4.36RR121 pKa = 11.84SFGRR125 pKa = 11.84IVEE128 pKa = 4.17ALHH131 pKa = 6.69VNLSHH136 pKa = 7.34QIDD139 pKa = 3.95PLRR142 pKa = 11.84WCASLHH148 pKa = 6.41DD149 pKa = 4.82EE150 pKa = 4.57YY151 pKa = 10.6PAEE154 pKa = 3.97IHH156 pKa = 6.21QLSVQNRR163 pKa = 11.84VQFAEE168 pKa = 4.03LLKK171 pKa = 10.16VGRR174 pKa = 11.84WVHH177 pKa = 5.13QAHH180 pKa = 6.38FTTNPLYY187 pKa = 10.5EE188 pKa = 4.5SGNIISKK195 pKa = 10.26FDD197 pKa = 3.72PPGGAFQDD205 pKa = 3.95VTPDD209 pKa = 2.96WLVNLILRR217 pKa = 11.84LHH219 pKa = 7.11DD220 pKa = 3.6GTAEE224 pKa = 3.89EE225 pKa = 5.78AIPFCNRR232 pKa = 11.84VSSS235 pKa = 3.7
MM1 pKa = 7.44GGVLSSVVEE10 pKa = 4.55MITMAVEE17 pKa = 3.9LSAATGISMDD27 pKa = 3.72ALLTGEE33 pKa = 4.68ALAALEE39 pKa = 4.57TEE41 pKa = 4.69VSSVMTIQGISSLEE55 pKa = 3.81ALAQLGWSAEE65 pKa = 4.17QFSNMAFISTSFTQAIGYY83 pKa = 9.53GVMFQTVTGISGLVQAGIRR102 pKa = 11.84LGFNVAAASRR112 pKa = 11.84RR113 pKa = 11.84VEE115 pKa = 3.95EE116 pKa = 4.32AQLEE120 pKa = 4.36RR121 pKa = 11.84SFGRR125 pKa = 11.84IVEE128 pKa = 4.17ALHH131 pKa = 6.69VNLSHH136 pKa = 7.34QIDD139 pKa = 3.95PLRR142 pKa = 11.84WCASLHH148 pKa = 6.41DD149 pKa = 4.82EE150 pKa = 4.57YY151 pKa = 10.6PAEE154 pKa = 3.97IHH156 pKa = 6.21QLSVQNRR163 pKa = 11.84VQFAEE168 pKa = 4.03LLKK171 pKa = 10.16VGRR174 pKa = 11.84WVHH177 pKa = 5.13QAHH180 pKa = 6.38FTTNPLYY187 pKa = 10.5EE188 pKa = 4.5SGNIISKK195 pKa = 10.26FDD197 pKa = 3.72PPGGAFQDD205 pKa = 3.95VTPDD209 pKa = 2.96WLVNLILRR217 pKa = 11.84LHH219 pKa = 7.11DD220 pKa = 3.6GTAEE224 pKa = 3.89EE225 pKa = 5.78AIPFCNRR232 pKa = 11.84VSSS235 pKa = 3.7
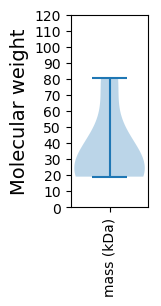
Molecular weight: 25.46 kDa
Isoelectric point according different methods:
Protein with the highest isoelectric point:
>tr|A0A1S7J013|A0A1S7J013_9POLY Minor capsid protein VP2 OS=Miniopterus schreibersii polyomavirus 2 OX=1904409 PE=3 SV=1
MM1 pKa = 7.94DD2 pKa = 4.96PVRR5 pKa = 11.84SEE7 pKa = 4.1SDD9 pKa = 3.36TLRR12 pKa = 11.84GPPEE16 pKa = 4.1YY17 pKa = 10.78LPMKK21 pKa = 10.38GLDD24 pKa = 3.24PSQIYY29 pKa = 10.28IAMNPVTPPHH39 pKa = 6.25QKK41 pKa = 10.16RR42 pKa = 11.84PPPQAKK48 pKa = 9.42PPPQDD53 pKa = 3.8TIPTPLILDD62 pKa = 3.82VDD64 pKa = 4.43SLPPPLPPKK73 pKa = 9.52TRR75 pKa = 11.84SPPRR79 pKa = 11.84RR80 pKa = 11.84SVSLPSRR87 pKa = 11.84RR88 pKa = 11.84PPPNPLMVEE97 pKa = 4.05VEE99 pKa = 3.93NLEE102 pKa = 3.73RR103 pKa = 11.84SLRR106 pKa = 11.84QKK108 pKa = 10.51EE109 pKa = 4.02QDD111 pKa = 3.92LVTMWMDD118 pKa = 3.47LVRR121 pKa = 11.84ARR123 pKa = 11.84KK124 pKa = 7.53QASRR128 pKa = 11.84ARR130 pKa = 11.84HH131 pKa = 4.13QRR133 pKa = 11.84KK134 pKa = 7.3KK135 pKa = 10.2QKK137 pKa = 9.6WVMGLLIFLLVFLIILAMLYY157 pKa = 10.77LLIKK161 pKa = 10.33HH162 pKa = 6.74LIASS166 pKa = 4.21
MM1 pKa = 7.94DD2 pKa = 4.96PVRR5 pKa = 11.84SEE7 pKa = 4.1SDD9 pKa = 3.36TLRR12 pKa = 11.84GPPEE16 pKa = 4.1YY17 pKa = 10.78LPMKK21 pKa = 10.38GLDD24 pKa = 3.24PSQIYY29 pKa = 10.28IAMNPVTPPHH39 pKa = 6.25QKK41 pKa = 10.16RR42 pKa = 11.84PPPQAKK48 pKa = 9.42PPPQDD53 pKa = 3.8TIPTPLILDD62 pKa = 3.82VDD64 pKa = 4.43SLPPPLPPKK73 pKa = 9.52TRR75 pKa = 11.84SPPRR79 pKa = 11.84RR80 pKa = 11.84SVSLPSRR87 pKa = 11.84RR88 pKa = 11.84PPPNPLMVEE97 pKa = 4.05VEE99 pKa = 3.93NLEE102 pKa = 3.73RR103 pKa = 11.84SLRR106 pKa = 11.84QKK108 pKa = 10.51EE109 pKa = 4.02QDD111 pKa = 3.92LVTMWMDD118 pKa = 3.47LVRR121 pKa = 11.84ARR123 pKa = 11.84KK124 pKa = 7.53QASRR128 pKa = 11.84ARR130 pKa = 11.84HH131 pKa = 4.13QRR133 pKa = 11.84KK134 pKa = 7.3KK135 pKa = 10.2QKK137 pKa = 9.6WVMGLLIFLLVFLIILAMLYY157 pKa = 10.77LLIKK161 pKa = 10.33HH162 pKa = 6.74LIASS166 pKa = 4.21
Molecular weight: 19.02 kDa
Isoelectric point according different methods:
Peptides (in silico digests for buttom-up proteomics)
Below you can find in silico digests of the whole proteome with Trypsin, Chymotrypsin, Trypsin+LysC, LysN, ArgC proteases suitable for different mass spec machines.| Try ESI |
 |
|---|
| ChTry ESI |
|
|---|
| ArgC ESI |
|
|---|
| LysN ESI |
|
|---|
| TryLysC ESI |
|
|---|
| Try MALDI |
|
|---|
| ChTry MALDI |
|
|---|
| ArgC MALDI |
|
|---|
| LysN MALDI |
|
|---|
| TryLysC MALDI |
|
|---|
| Try LTQ |
|
|---|
| ChTry LTQ |
|
|---|
| ArgC LTQ |
|
|---|
| LysN LTQ |
|
|---|
| TryLysC LTQ |
|
|---|
| Try MSlow |
|
|---|
| ChTry MSlow |
|
|---|
| ArgC MSlow |
|
|---|
| LysN MSlow |
|
|---|
| TryLysC MSlow |
|
|---|
| Try MShigh |
|
|---|
| ChTry MShigh |
|
|---|
| ArgC MShigh |
|
|---|
| LysN MShigh |
|
|---|
| TryLysC MShigh |
|
|---|
General Statistics
Number of major isoforms |
Number of additional isoforms |
Number of all proteins |
Number of amino acids |
Min. Seq. Length |
Max. Seq. Length |
Avg. Seq. Length |
Avg. Mol. Weight |
|---|---|---|---|---|---|---|---|
0 |
1874 |
166 |
714 |
312.3 |
34.97 |
Amino acid frequency
Ala |
Cys |
Asp |
Glu |
Phe |
Gly |
His |
Ile |
Lys |
Leu |
|---|---|---|---|---|---|---|---|---|---|
6.564 ± 0.928 | 2.561 ± 0.727 |
4.696 ± 0.418 | 6.137 ± 0.539 |
4.216 ± 0.759 | 5.816 ± 1.037 |
2.295 ± 0.278 | 4.589 ± 0.626 |
5.176 ± 1.06 | 11.099 ± 0.897 |
Met |
Asn |
Gln |
Pro |
Arg |
Ser |
Thr |
Val |
Trp |
Tyr |
|---|---|---|---|---|---|---|---|---|---|
2.615 ± 0.347 | 3.522 ± 0.386 |
6.403 ± 1.619 | 5.016 ± 0.53 |
5.443 ± 0.635 | 7.898 ± 0.731 |
5.55 ± 0.316 | 6.51 ± 0.527 |
1.334 ± 0.376 | 2.561 ± 0.437 |
Most of the basic statistics you can see at this page can be downloaded from this CSV file
See this proteome in:

Proteome-pI is available under Creative Commons Attribution-NoDerivs license, for more details see here
| Reference: Kozlowski LP. Proteome-pI 2.0: Proteome Isoelectric Point Database Update. Nucleic Acids Res. 2021, doi: 10.1093/nar/gkab944 | Contact: Lukasz P. Kozlowski |