Staphylococcus phage StauST398-4
Taxonomy: Viruses; Duplodnaviria; Heunggongvirae; Uroviricota; Caudoviricetes; Caudovirales; Siphoviridae; Bronfenbrennervirinae; Biseptimavirus; Staphylococcus virus StauST398-4
Average proteome isoelectric point is 6.73
Get precalculated fractions of proteins
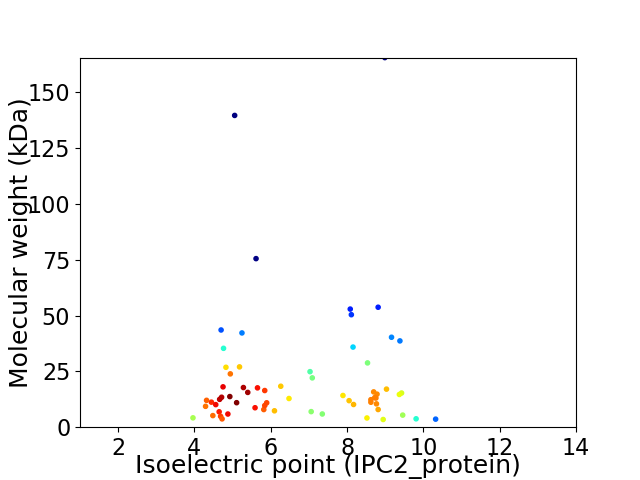
Virtual 2D-PAGE plot for 65 proteins (isoelectric point calculated using IPC2_protein)
Get csv file with sequences according to given criteria:
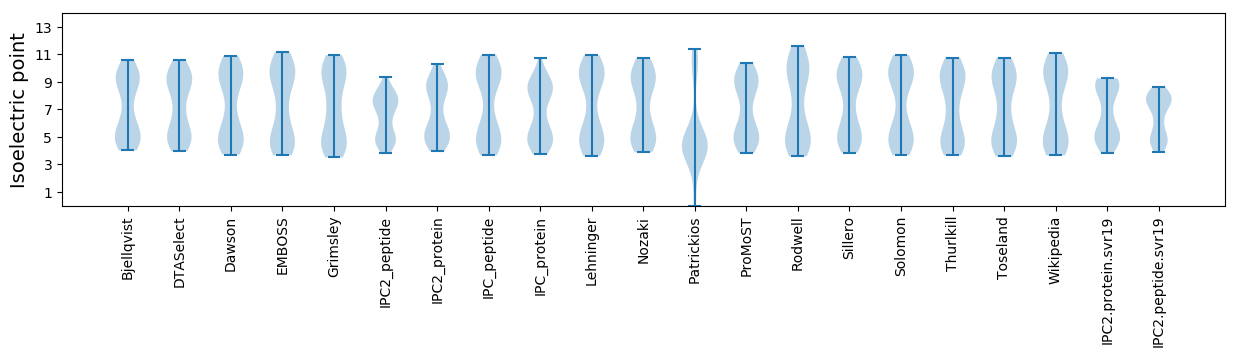
* You can choose from 21 different methods for calculating isoelectric point
Summary statistics related to proteome-wise predictions
Protein with the lowest isoelectric point:
>tr|W5R9G5|W5R9G5_9CAUD Terminase large subunit OS=Staphylococcus phage StauST398-4 OX=1308896 GN=StauST398-4_0039 PE=4 SV=1
MM1 pKa = 7.41YY2 pKa = 10.23EE3 pKa = 3.56LGKK6 pKa = 10.79YY7 pKa = 7.28VTEE10 pKa = 3.84QVYY13 pKa = 10.94IMMTANDD20 pKa = 4.14DD21 pKa = 3.7VEE23 pKa = 5.3APSDD27 pKa = 3.63YY28 pKa = 11.0VFRR31 pKa = 11.84AEE33 pKa = 4.19VSEE36 pKa = 4.17
MM1 pKa = 7.41YY2 pKa = 10.23EE3 pKa = 3.56LGKK6 pKa = 10.79YY7 pKa = 7.28VTEE10 pKa = 3.84QVYY13 pKa = 10.94IMMTANDD20 pKa = 4.14DD21 pKa = 3.7VEE23 pKa = 5.3APSDD27 pKa = 3.63YY28 pKa = 11.0VFRR31 pKa = 11.84AEE33 pKa = 4.19VSEE36 pKa = 4.17
Molecular weight: 4.19 kDa
Isoelectric point according different methods:
Protein with the highest isoelectric point:
>tr|W5R9H0|W5R9H0_9CAUD Uncharacterized protein OS=Staphylococcus phage StauST398-4 OX=1308896 GN=StauST398-4_0044 PE=4 SV=1
MM1 pKa = 7.43YY2 pKa = 10.54ILMNRR7 pKa = 11.84KK8 pKa = 8.92SRR10 pKa = 11.84IVSNLLKK17 pKa = 10.9NGIFQHH23 pKa = 5.1YY24 pKa = 8.73HH25 pKa = 5.54FKK27 pKa = 11.01GLSS30 pKa = 3.11
MM1 pKa = 7.43YY2 pKa = 10.54ILMNRR7 pKa = 11.84KK8 pKa = 8.92SRR10 pKa = 11.84IVSNLLKK17 pKa = 10.9NGIFQHH23 pKa = 5.1YY24 pKa = 8.73HH25 pKa = 5.54FKK27 pKa = 11.01GLSS30 pKa = 3.11
Molecular weight: 3.61 kDa
Isoelectric point according different methods:
Peptides (in silico digests for buttom-up proteomics)
Below you can find in silico digests of the whole proteome with Trypsin, Chymotrypsin, Trypsin+LysC, LysN, ArgC proteases suitable for different mass spec machines.| Try ESI |
 |
|---|
| ChTry ESI |
|
|---|
| ArgC ESI |
|
|---|
| LysN ESI |
|
|---|
| TryLysC ESI |
|
|---|
| Try MALDI |
|
|---|
| ChTry MALDI |
|
|---|
| ArgC MALDI |
|
|---|
| LysN MALDI |
|
|---|
| TryLysC MALDI |
|
|---|
| Try LTQ |
|
|---|
| ChTry LTQ |
|
|---|
| ArgC LTQ |
|
|---|
| LysN LTQ |
|
|---|
| TryLysC LTQ |
|
|---|
| Try MSlow |
|
|---|
| ChTry MSlow |
|
|---|
| ArgC MSlow |
|
|---|
| LysN MSlow |
|
|---|
| TryLysC MSlow |
|
|---|
| Try MShigh |
|
|---|
| ChTry MShigh |
|
|---|
| ArgC MShigh |
|
|---|
| LysN MShigh |
|
|---|
| TryLysC MShigh |
|
|---|
General Statistics
Number of major isoforms |
Number of additional isoforms |
Number of all proteins |
Number of amino acids |
Min. Seq. Length |
Max. Seq. Length |
Avg. Seq. Length |
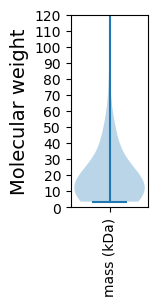
Avg. Mol. Weight |
|---|---|---|---|---|---|---|---|
0 |
12463 |
30 |
1509 |
191.7 |
21.97 |
Amino acid frequency
Ala |
Cys |
Asp |
Glu |
Phe |
Gly |
His |
Ile |
Lys |
Leu |
|---|---|---|---|---|---|---|---|---|---|
5.649 ± 0.406 | 0.514 ± 0.105 |
6.098 ± 0.348 | 7.743 ± 0.517 |
4.132 ± 0.291 | 5.753 ± 0.678 |
1.829 ± 0.155 | 7.815 ± 0.291 |
9.693 ± 0.386 | 8.056 ± 0.355 |
Met |
Asn |
Gln |
Pro |
Arg |
Ser |
Thr |
Val |
Trp |
Tyr |
|---|---|---|---|---|---|---|---|---|---|
2.471 ± 0.19 | 7.101 ± 0.337 |
2.616 ± 0.154 | 3.964 ± 0.3 |
4.237 ± 0.284 | 5.857 ± 0.248 |
5.504 ± 0.215 | 5.753 ± 0.229 |
0.979 ± 0.143 | 4.237 ± 0.33 |
Most of the basic statistics you can see at this page can be downloaded from this CSV file
See this proteome in:

Proteome-pI is available under Creative Commons Attribution-NoDerivs license, for more details see here
| Reference: Kozlowski LP. Proteome-pI 2.0: Proteome Isoelectric Point Database Update. Nucleic Acids Res. 2021, doi: 10.1093/nar/gkab944 | Contact: Lukasz P. Kozlowski |