Acidithiobacillus ferrooxidans (Thiobacillus ferrooxidans)
Taxonomy: cellular organisms; Bacteria; Proteobacteria; Acidithiobacillia; Acidithiobacillales; Acidithiobacillaceae; Acidithiobacillu
Average proteome isoelectric point is 6.82
Get precalculated fractions of proteins
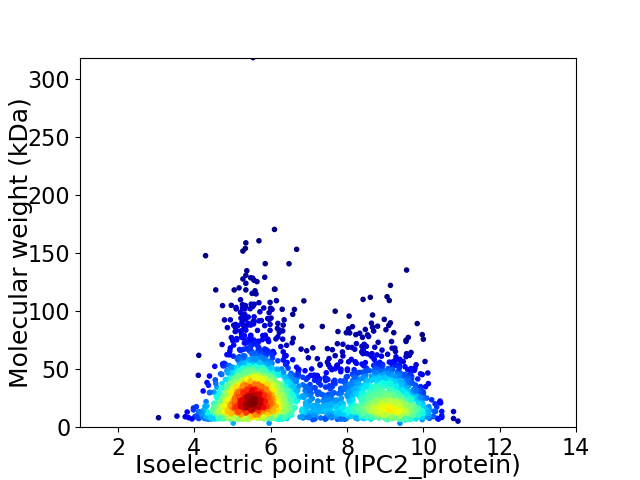
Virtual 2D-PAGE plot for 2816 proteins (isoelectric point calculated using IPC2_protein)
Get csv file with sequences according to given criteria:
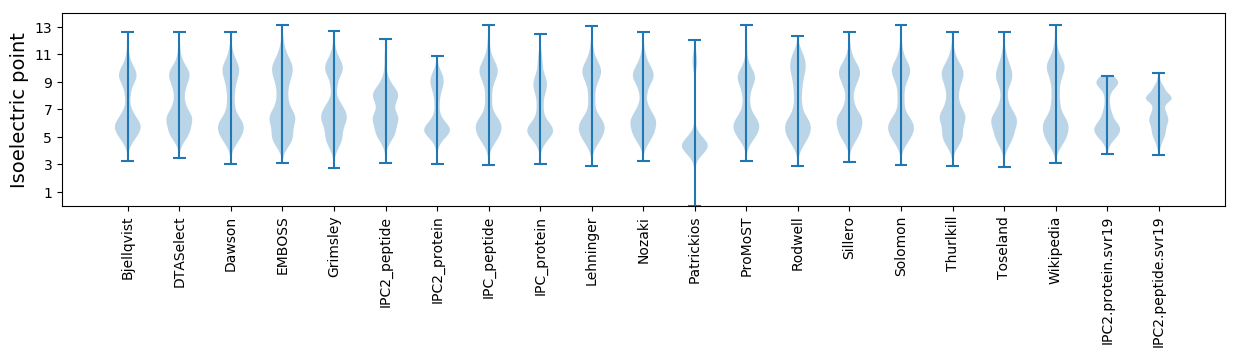
* You can choose from 21 different methods for calculating isoelectric point
Summary statistics related to proteome-wise predictions
Protein with the lowest isoelectric point:
>tr|A0A179BMN5|A0A179BMN5_ACIFR Uncharacterized protein OS=Acidithiobacillus ferrooxidans OX=920 GN=A4H96_03590 PE=4 SV=1
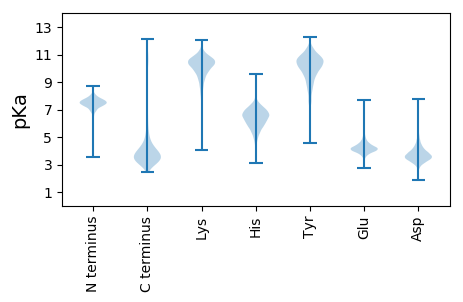
MM1 pKa = 7.0ATGYY5 pKa = 10.96VDD7 pKa = 3.42GFEE10 pKa = 4.17RR11 pKa = 11.84AMGVLGLDD19 pKa = 3.58VEE21 pKa = 5.65AMEE24 pKa = 5.18EE25 pKa = 3.9WLLDD29 pKa = 3.82HH30 pKa = 7.01NIEE33 pKa = 4.63RR34 pKa = 11.84CPSCDD39 pKa = 2.61WFVASHH45 pKa = 6.43EE46 pKa = 4.18LLNDD50 pKa = 3.22EE51 pKa = 4.99GEE53 pKa = 4.31IDD55 pKa = 4.39GLCDD59 pKa = 3.21NCRR62 pKa = 11.84SS63 pKa = 3.59
MM1 pKa = 7.0ATGYY5 pKa = 10.96VDD7 pKa = 3.42GFEE10 pKa = 4.17RR11 pKa = 11.84AMGVLGLDD19 pKa = 3.58VEE21 pKa = 5.65AMEE24 pKa = 5.18EE25 pKa = 3.9WLLDD29 pKa = 3.82HH30 pKa = 7.01NIEE33 pKa = 4.63RR34 pKa = 11.84CPSCDD39 pKa = 2.61WFVASHH45 pKa = 6.43EE46 pKa = 4.18LLNDD50 pKa = 3.22EE51 pKa = 4.99GEE53 pKa = 4.31IDD55 pKa = 4.39GLCDD59 pKa = 3.21NCRR62 pKa = 11.84SS63 pKa = 3.59
Molecular weight: 7.08 kDa
Isoelectric point according different methods:
Protein with the highest isoelectric point:
>tr|A0A179B793|A0A179B793_ACIFR Uncharacterized protein OS=Acidithiobacillus ferrooxidans OX=920 GN=A4H96_13160 PE=4 SV=1
MM1 pKa = 7.45KK2 pKa = 9.51RR3 pKa = 11.84TFQPSVVHH11 pKa = 6.89RR12 pKa = 11.84KK13 pKa = 7.38RR14 pKa = 11.84THH16 pKa = 5.56GFRR19 pKa = 11.84ARR21 pKa = 11.84MATKK25 pKa = 10.29SGRR28 pKa = 11.84LVLKK32 pKa = 10.26RR33 pKa = 11.84RR34 pKa = 11.84RR35 pKa = 11.84AKK37 pKa = 10.25GRR39 pKa = 11.84QRR41 pKa = 11.84LCPP44 pKa = 3.78
MM1 pKa = 7.45KK2 pKa = 9.51RR3 pKa = 11.84TFQPSVVHH11 pKa = 6.89RR12 pKa = 11.84KK13 pKa = 7.38RR14 pKa = 11.84THH16 pKa = 5.56GFRR19 pKa = 11.84ARR21 pKa = 11.84MATKK25 pKa = 10.29SGRR28 pKa = 11.84LVLKK32 pKa = 10.26RR33 pKa = 11.84RR34 pKa = 11.84RR35 pKa = 11.84AKK37 pKa = 10.25GRR39 pKa = 11.84QRR41 pKa = 11.84LCPP44 pKa = 3.78
Molecular weight: 5.26 kDa
Isoelectric point according different methods:
Peptides (in silico digests for buttom-up proteomics)
Below you can find in silico digests of the whole proteome with Trypsin, Chymotrypsin, Trypsin+LysC, LysN, ArgC proteases suitable for different mass spec machines.| Try ESI |
 |
|---|
| ChTry ESI |
|
|---|
| ArgC ESI |
|
|---|
| LysN ESI |
|
|---|
| TryLysC ESI |
|
|---|
| Try MALDI |
|
|---|
| ChTry MALDI |
|
|---|
| ArgC MALDI |
|
|---|
| LysN MALDI |
|
|---|
| TryLysC MALDI |
|
|---|
| Try LTQ |
|
|---|
| ChTry LTQ |
|
|---|
| ArgC LTQ |
|
|---|
| LysN LTQ |
|
|---|
| TryLysC LTQ |
|
|---|
| Try MSlow |
|
|---|
| ChTry MSlow |
|
|---|
| ArgC MSlow |
|
|---|
| LysN MSlow |
|
|---|
| TryLysC MSlow |
|
|---|
| Try MShigh |
|
|---|
| ChTry MShigh |
|
|---|
| ArgC MShigh |
|
|---|
| LysN MShigh |
|
|---|
| TryLysC MShigh |
|
|---|
General Statistics
Number of major isoforms |
Number of additional isoforms |
Number of all proteins |
Number of amino acids |
Min. Seq. Length |
Max. Seq. Length |
Avg. Seq. Length |
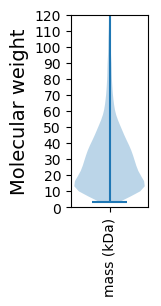
Avg. Mol. Weight |
|---|---|---|---|---|---|---|---|
0 |
808942 |
30 |
2856 |
287.3 |
31.62 |
Amino acid frequency
Ala |
Cys |
Asp |
Glu |
Phe |
Gly |
His |
Ile |
Lys |
Leu |
|---|---|---|---|---|---|---|---|---|---|
11.064 ± 0.066 | 0.972 ± 0.017 |
5.134 ± 0.037 | 5.51 ± 0.045 |
3.561 ± 0.034 | 7.915 ± 0.045 |
2.683 ± 0.025 | 5.456 ± 0.039 |
3.351 ± 0.038 | 10.892 ± 0.063 |
Met |
Asn |
Gln |
Pro |
Arg |
Ser |
Thr |
Val |
Trp |
Tyr |
|---|---|---|---|---|---|---|---|---|---|
2.602 ± 0.021 | 2.953 ± 0.037 |
5.074 ± 0.033 | 4.299 ± 0.029 |
6.799 ± 0.053 | 5.467 ± 0.037 |
5.061 ± 0.031 | 6.992 ± 0.041 |
1.595 ± 0.023 | 2.621 ± 0.029 |
Most of the basic statistics you can see at this page can be downloaded from this CSV file
See this proteome in:

Proteome-pI is available under Creative Commons Attribution-NoDerivs license, for more details see here
| Reference: Kozlowski LP. Proteome-pI 2.0: Proteome Isoelectric Point Database Update. Nucleic Acids Res. 2021, doi: 10.1093/nar/gkab944 | Contact: Lukasz P. Kozlowski |