Lachnotalea sp. AF33-28
Taxonomy: cellular organisms; Bacteria; Terrabacteria group; Firmicutes; Clostridia; Eubacteriales; Lachnospiraceae; Lachnotalea; unclassified Lachnotalea
Average proteome isoelectric point is 6.1
Get precalculated fractions of proteins
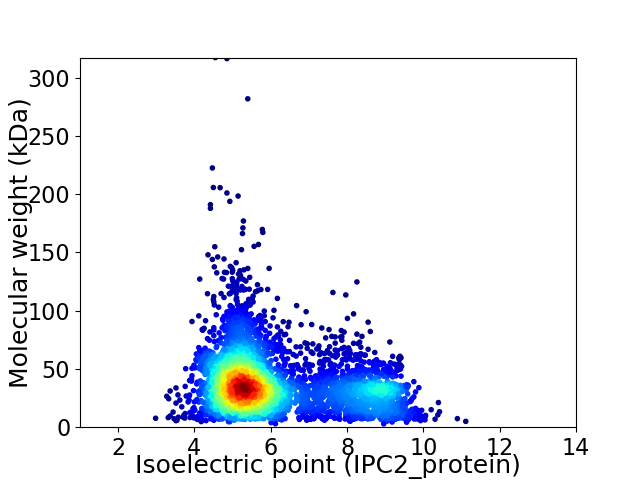
Virtual 2D-PAGE plot for 4332 proteins (isoelectric point calculated using IPC2_protein)
Get csv file with sequences according to given criteria:
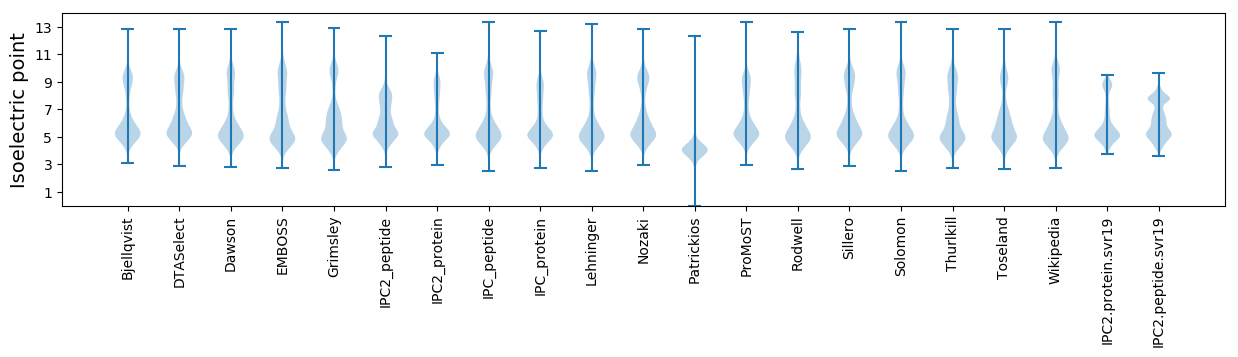
* You can choose from 21 different methods for calculating isoelectric point
Summary statistics related to proteome-wise predictions
Protein with the lowest isoelectric point:
>tr|A0A416ESW3|A0A416ESW3_9FIRM Extracellular solute-binding protein OS=Lachnotalea sp. AF33-28 OX=2292046 GN=DWZ56_01175 PE=4 SV=1
MM1 pKa = 7.43RR2 pKa = 11.84RR3 pKa = 11.84CAISRR8 pKa = 11.84IAEE11 pKa = 3.85FAVYY15 pKa = 9.78EE16 pKa = 4.04FTMDD20 pKa = 4.03GLCIVMLINTLSCMKK35 pKa = 10.4GCFVVSGQTFGGKK48 pKa = 8.29NMKK51 pKa = 10.0KK52 pKa = 9.99LLAIILTCALAVSLAACSAPAPKK75 pKa = 9.25EE76 pKa = 4.2TDD78 pKa = 3.1VSTAAAEE85 pKa = 4.41TTQTTKK91 pKa = 10.83AAEE94 pKa = 4.37TPEE97 pKa = 4.4TTQSAGTEE105 pKa = 4.07QTAEE109 pKa = 3.94TSAAALPTTDD119 pKa = 4.39PSGAQIKK126 pKa = 9.95VPEE129 pKa = 5.15DD130 pKa = 3.21IEE132 pKa = 4.61TIAVLSPSIAQTIIGLGLGDD152 pKa = 5.39KK153 pKa = 10.2IAAYY157 pKa = 9.69DD158 pKa = 3.73AQSVGLEE165 pKa = 4.14GLPEE169 pKa = 4.25SDD171 pKa = 3.22IVLDD175 pKa = 4.55FMQPDD180 pKa = 4.06MEE182 pKa = 4.74QLAALNPDD190 pKa = 3.51VLFVSNMTLYY200 pKa = 10.73DD201 pKa = 3.53QEE203 pKa = 5.01NPYY206 pKa = 8.35QTLIDD211 pKa = 3.44QGVCVICVPTSEE223 pKa = 4.97SIAAIQSDD231 pKa = 3.84ISFLAAVLGVPEE243 pKa = 4.89KK244 pKa = 11.06GEE246 pKa = 4.0AMLADD251 pKa = 3.95MQAQIDD257 pKa = 4.26SIAAIGSTITDD268 pKa = 3.03KK269 pKa = 10.54KK270 pKa = 8.93TVYY273 pKa = 10.49FEE275 pKa = 3.77IAAAPSMYY283 pKa = 10.53SFGSGVFLNEE293 pKa = 3.88MIEE296 pKa = 4.6LIGAKK301 pKa = 10.22NILADD306 pKa = 3.58QNGWLGVEE314 pKa = 4.24AEE316 pKa = 4.56TVVAANPDD324 pKa = 3.8VILTNVNYY332 pKa = 10.03IEE334 pKa = 5.21NPTQEE339 pKa = 3.91IMDD342 pKa = 3.94RR343 pKa = 11.84EE344 pKa = 4.54GWADD348 pKa = 3.33MTAVADD354 pKa = 3.77KK355 pKa = 10.76SVYY358 pKa = 10.85YY359 pKa = 9.34IDD361 pKa = 4.95NMASSSSNQNIVKK374 pKa = 10.38ALVQMAEE381 pKa = 4.13AIYY384 pKa = 9.99PEE386 pKa = 5.06YY387 pKa = 9.76YY388 pKa = 10.11TEE390 pKa = 4.0
MM1 pKa = 7.43RR2 pKa = 11.84RR3 pKa = 11.84CAISRR8 pKa = 11.84IAEE11 pKa = 3.85FAVYY15 pKa = 9.78EE16 pKa = 4.04FTMDD20 pKa = 4.03GLCIVMLINTLSCMKK35 pKa = 10.4GCFVVSGQTFGGKK48 pKa = 8.29NMKK51 pKa = 10.0KK52 pKa = 9.99LLAIILTCALAVSLAACSAPAPKK75 pKa = 9.25EE76 pKa = 4.2TDD78 pKa = 3.1VSTAAAEE85 pKa = 4.41TTQTTKK91 pKa = 10.83AAEE94 pKa = 4.37TPEE97 pKa = 4.4TTQSAGTEE105 pKa = 4.07QTAEE109 pKa = 3.94TSAAALPTTDD119 pKa = 4.39PSGAQIKK126 pKa = 9.95VPEE129 pKa = 5.15DD130 pKa = 3.21IEE132 pKa = 4.61TIAVLSPSIAQTIIGLGLGDD152 pKa = 5.39KK153 pKa = 10.2IAAYY157 pKa = 9.69DD158 pKa = 3.73AQSVGLEE165 pKa = 4.14GLPEE169 pKa = 4.25SDD171 pKa = 3.22IVLDD175 pKa = 4.55FMQPDD180 pKa = 4.06MEE182 pKa = 4.74QLAALNPDD190 pKa = 3.51VLFVSNMTLYY200 pKa = 10.73DD201 pKa = 3.53QEE203 pKa = 5.01NPYY206 pKa = 8.35QTLIDD211 pKa = 3.44QGVCVICVPTSEE223 pKa = 4.97SIAAIQSDD231 pKa = 3.84ISFLAAVLGVPEE243 pKa = 4.89KK244 pKa = 11.06GEE246 pKa = 4.0AMLADD251 pKa = 3.95MQAQIDD257 pKa = 4.26SIAAIGSTITDD268 pKa = 3.03KK269 pKa = 10.54KK270 pKa = 8.93TVYY273 pKa = 10.49FEE275 pKa = 3.77IAAAPSMYY283 pKa = 10.53SFGSGVFLNEE293 pKa = 3.88MIEE296 pKa = 4.6LIGAKK301 pKa = 10.22NILADD306 pKa = 3.58QNGWLGVEE314 pKa = 4.24AEE316 pKa = 4.56TVVAANPDD324 pKa = 3.8VILTNVNYY332 pKa = 10.03IEE334 pKa = 5.21NPTQEE339 pKa = 3.91IMDD342 pKa = 3.94RR343 pKa = 11.84EE344 pKa = 4.54GWADD348 pKa = 3.33MTAVADD354 pKa = 3.77KK355 pKa = 10.76SVYY358 pKa = 10.85YY359 pKa = 9.34IDD361 pKa = 4.95NMASSSSNQNIVKK374 pKa = 10.38ALVQMAEE381 pKa = 4.13AIYY384 pKa = 9.99PEE386 pKa = 5.06YY387 pKa = 9.76YY388 pKa = 10.11TEE390 pKa = 4.0
Molecular weight: 41.42 kDa
Isoelectric point according different methods:
Protein with the highest isoelectric point:
>tr|A0A416EL82|A0A416EL82_9FIRM LysR family transcriptional regulator OS=Lachnotalea sp. AF33-28 OX=2292046 GN=DWZ56_08475 PE=3 SV=1
MM1 pKa = 7.67KK2 pKa = 8.71MTFQPKK8 pKa = 7.43TRR10 pKa = 11.84QRR12 pKa = 11.84AKK14 pKa = 9.02VHH16 pKa = 5.68GFRR19 pKa = 11.84SRR21 pKa = 11.84MSTPGGRR28 pKa = 11.84KK29 pKa = 8.8VLAARR34 pKa = 11.84RR35 pKa = 11.84AKK37 pKa = 10.18GRR39 pKa = 11.84KK40 pKa = 8.18QLSAA44 pKa = 3.9
MM1 pKa = 7.67KK2 pKa = 8.71MTFQPKK8 pKa = 7.43TRR10 pKa = 11.84QRR12 pKa = 11.84AKK14 pKa = 9.02VHH16 pKa = 5.68GFRR19 pKa = 11.84SRR21 pKa = 11.84MSTPGGRR28 pKa = 11.84KK29 pKa = 8.8VLAARR34 pKa = 11.84RR35 pKa = 11.84AKK37 pKa = 10.18GRR39 pKa = 11.84KK40 pKa = 8.18QLSAA44 pKa = 3.9
Molecular weight: 5.01 kDa
Isoelectric point according different methods:
Peptides (in silico digests for buttom-up proteomics)
Below you can find in silico digests of the whole proteome with Trypsin, Chymotrypsin, Trypsin+LysC, LysN, ArgC proteases suitable for different mass spec machines.| Try ESI |
 |
|---|
| ChTry ESI |
|
|---|
| ArgC ESI |
|
|---|
| LysN ESI |
|
|---|
| TryLysC ESI |
|
|---|
| Try MALDI |
|
|---|
| ChTry MALDI |
|
|---|
| ArgC MALDI |
|
|---|
| LysN MALDI |
|
|---|
| TryLysC MALDI |
|
|---|
| Try LTQ |
|
|---|
| ChTry LTQ |
|
|---|
| ArgC LTQ |
|
|---|
| LysN LTQ |
|
|---|
| TryLysC LTQ |
|
|---|
| Try MSlow |
|
|---|
| ChTry MSlow |
|
|---|
| ArgC MSlow |
|
|---|
| LysN MSlow |
|
|---|
| TryLysC MSlow |
|
|---|
| Try MShigh |
|
|---|
| ChTry MShigh |
|
|---|
| ArgC MShigh |
|
|---|
| LysN MShigh |
|
|---|
| TryLysC MShigh |
|
|---|
General Statistics
Number of major isoforms |
Number of additional isoforms |
Number of all proteins |
Number of amino acids |
Min. Seq. Length |
Max. Seq. Length |
Avg. Seq. Length |
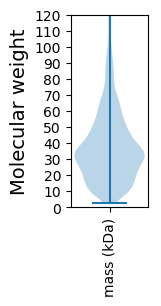
Avg. Mol. Weight |
|---|---|---|---|---|---|---|---|
0 |
1520675 |
26 |
3006 |
351.0 |
39.42 |
Amino acid frequency
Ala |
Cys |
Asp |
Glu |
Phe |
Gly |
His |
Ile |
Lys |
Leu |
|---|---|---|---|---|---|---|---|---|---|
7.888 ± 0.04 | 1.671 ± 0.014 |
5.601 ± 0.027 | 7.285 ± 0.039 |
4.197 ± 0.024 | 7.33 ± 0.037 |
1.79 ± 0.016 | 6.684 ± 0.031 |
5.665 ± 0.027 | 9.579 ± 0.044 |
Met |
Asn |
Gln |
Pro |
Arg |
Ser |
Thr |
Val |
Trp |
Tyr |
|---|---|---|---|---|---|---|---|---|---|
3.128 ± 0.019 | 3.911 ± 0.022 |
3.64 ± 0.019 | 3.246 ± 0.02 |
5.218 ± 0.029 | 5.874 ± 0.028 |
5.178 ± 0.026 | 6.587 ± 0.029 |
1.152 ± 0.016 | 4.376 ± 0.024 |
Most of the basic statistics you can see at this page can be downloaded from this CSV file
See this proteome in:

Proteome-pI is available under Creative Commons Attribution-NoDerivs license, for more details see here
| Reference: Kozlowski LP. Proteome-pI 2.0: Proteome Isoelectric Point Database Update. Nucleic Acids Res. 2021, doi: 10.1093/nar/gkab944 | Contact: Lukasz P. Kozlowski |