bacterium HR33
Taxonomy: cellular organisms; Bacteria; unclassified Bacteria
Average proteome isoelectric point is 6.94
Get precalculated fractions of proteins
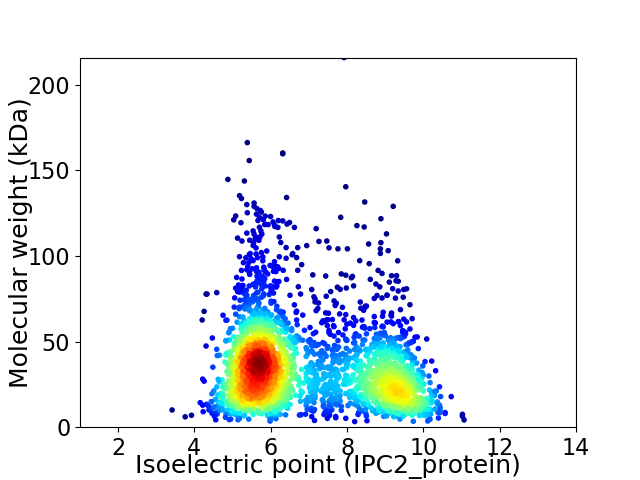
Virtual 2D-PAGE plot for 2661 proteins (isoelectric point calculated using IPC2_protein)
Get csv file with sequences according to given criteria:
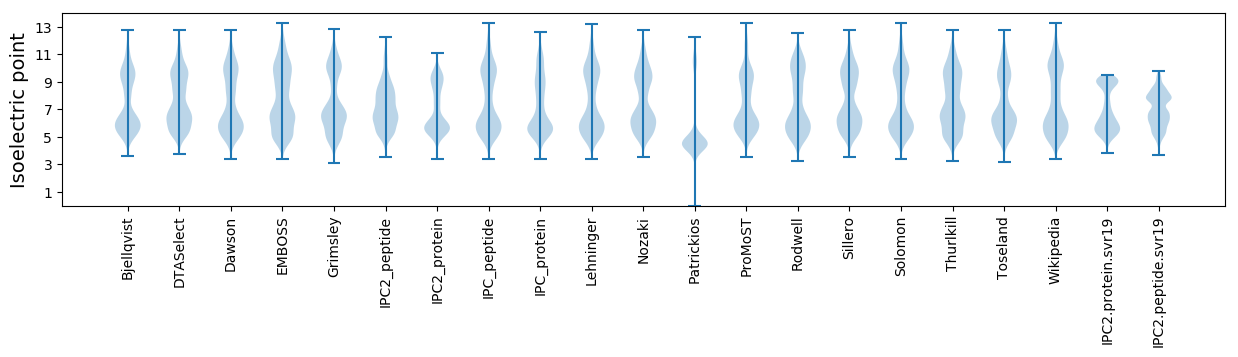
* You can choose from 21 different methods for calculating isoelectric point
Summary statistics related to proteome-wise predictions
Protein with the lowest isoelectric point:
>tr|A0A2H6A6T8|A0A2H6A6T8_9BACT FHA domain-containing protein FhaB OS=bacterium HR33 OX=2035428 GN=fhaB PE=4 SV=1
MM1 pKa = 7.33SLAAEE6 pKa = 4.56CPEE9 pKa = 4.22CAAKK13 pKa = 10.12IALNDD18 pKa = 3.78DD19 pKa = 4.23VISGEE24 pKa = 4.0IVQCGDD30 pKa = 3.52CGLEE34 pKa = 4.06LEE36 pKa = 4.62VVRR39 pKa = 11.84DD40 pKa = 3.62GSVTLRR46 pKa = 11.84PAPEE50 pKa = 4.13EE51 pKa = 3.99EE52 pKa = 4.4EE53 pKa = 4.33DD54 pKa = 3.25WGEE57 pKa = 3.78
MM1 pKa = 7.33SLAAEE6 pKa = 4.56CPEE9 pKa = 4.22CAAKK13 pKa = 10.12IALNDD18 pKa = 3.78DD19 pKa = 4.23VISGEE24 pKa = 4.0IVQCGDD30 pKa = 3.52CGLEE34 pKa = 4.06LEE36 pKa = 4.62VVRR39 pKa = 11.84DD40 pKa = 3.62GSVTLRR46 pKa = 11.84PAPEE50 pKa = 4.13EE51 pKa = 3.99EE52 pKa = 4.4EE53 pKa = 4.33DD54 pKa = 3.25WGEE57 pKa = 3.78
Molecular weight: 6.06 kDa
Isoelectric point according different methods:
Protein with the highest isoelectric point:
>tr|A0A2H6A5N4|A0A2H6A5N4_9BACT Segregation and condensation protein A OS=bacterium HR33 OX=2035428 GN=scpA_3 PE=4 SV=1
MM1 pKa = 7.4AVSSATRR8 pKa = 11.84PFNKK12 pKa = 9.58KK13 pKa = 9.71ARR15 pKa = 11.84IRR17 pKa = 11.84AGPATPAAIPVSTKK31 pKa = 9.95IPAPIIAPTPIMVMSMSRR49 pKa = 11.84ISRR52 pKa = 11.84LRR54 pKa = 11.84RR55 pKa = 11.84TSTATAA61 pKa = 3.65
MM1 pKa = 7.4AVSSATRR8 pKa = 11.84PFNKK12 pKa = 9.58KK13 pKa = 9.71ARR15 pKa = 11.84IRR17 pKa = 11.84AGPATPAAIPVSTKK31 pKa = 9.95IPAPIIAPTPIMVMSMSRR49 pKa = 11.84ISRR52 pKa = 11.84LRR54 pKa = 11.84RR55 pKa = 11.84TSTATAA61 pKa = 3.65
Molecular weight: 6.42 kDa
Isoelectric point according different methods:
Peptides (in silico digests for buttom-up proteomics)
Below you can find in silico digests of the whole proteome with Trypsin, Chymotrypsin, Trypsin+LysC, LysN, ArgC proteases suitable for different mass spec machines.| Try ESI |
 |
|---|
| ChTry ESI |
|
|---|
| ArgC ESI |
|
|---|
| LysN ESI |
|
|---|
| TryLysC ESI |
|
|---|
| Try MALDI |
|
|---|
| ChTry MALDI |
|
|---|
| ArgC MALDI |
|
|---|
| LysN MALDI |
|
|---|
| TryLysC MALDI |
|
|---|
| Try LTQ |
|
|---|
| ChTry LTQ |
|
|---|
| ArgC LTQ |
|
|---|
| LysN LTQ |
|
|---|
| TryLysC LTQ |
|
|---|
| Try MSlow |
|
|---|
| ChTry MSlow |
|
|---|
| ArgC MSlow |
|
|---|
| LysN MSlow |
|
|---|
| TryLysC MSlow |
|
|---|
| Try MShigh |
|
|---|
| ChTry MShigh |
|
|---|
| ArgC MShigh |
|
|---|
| LysN MShigh |
|
|---|
| TryLysC MShigh |
|
|---|
General Statistics
Number of major isoforms |
Number of additional isoforms |
Number of all proteins |
Number of amino acids |
Min. Seq. Length |
Max. Seq. Length |
Avg. Seq. Length |
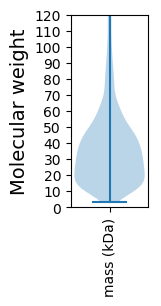
Avg. Mol. Weight |
|---|---|---|---|---|---|---|---|
0 |
916511 |
29 |
1969 |
344.4 |
37.7 |
Amino acid frequency
Ala |
Cys |
Asp |
Glu |
Phe |
Gly |
His |
Ile |
Lys |
Leu |
|---|---|---|---|---|---|---|---|---|---|
11.762 ± 0.066 | 0.764 ± 0.017 |
4.864 ± 0.033 | 6.792 ± 0.056 |
3.478 ± 0.028 | 8.84 ± 0.045 |
1.776 ± 0.02 | 4.429 ± 0.031 |
2.523 ± 0.029 | 10.823 ± 0.052 |
Met |
Asn |
Gln |
Pro |
Arg |
Ser |
Thr |
Val |
Trp |
Tyr |
|---|---|---|---|---|---|---|---|---|---|
1.765 ± 0.019 | 2.125 ± 0.029 |
5.65 ± 0.033 | 2.936 ± 0.024 |
9.021 ± 0.044 | 5.291 ± 0.031 |
4.699 ± 0.035 | 8.344 ± 0.041 |
1.563 ± 0.022 | 2.556 ± 0.028 |
Most of the basic statistics you can see at this page can be downloaded from this CSV file
See this proteome in:

Proteome-pI is available under Creative Commons Attribution-NoDerivs license, for more details see here
| Reference: Kozlowski LP. Proteome-pI 2.0: Proteome Isoelectric Point Database Update. Nucleic Acids Res. 2021, doi: 10.1093/nar/gkab944 | Contact: Lukasz P. Kozlowski |