Vibrio phage VMJ710
Taxonomy: Viruses; Duplodnaviria; Heunggongvirae; Uroviricota; Caudoviricetes; Caudovirales; Myoviridae; unclassified Myoviridae
Average proteome isoelectric point is 6.18
Get precalculated fractions of proteins
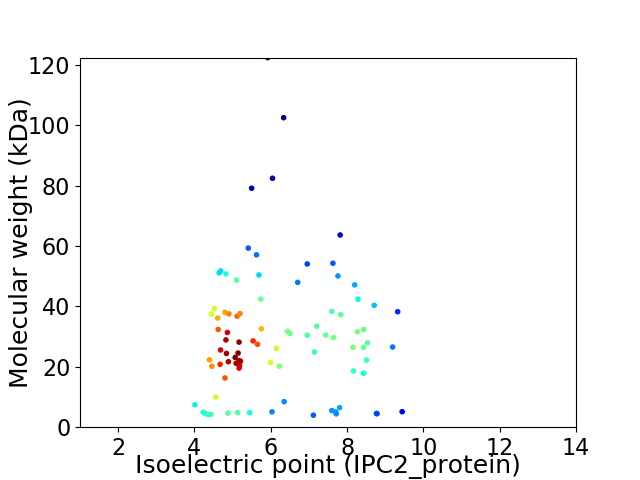
Virtual 2D-PAGE plot for 89 proteins (isoelectric point calculated using IPC2_protein)
Get csv file with sequences according to given criteria:
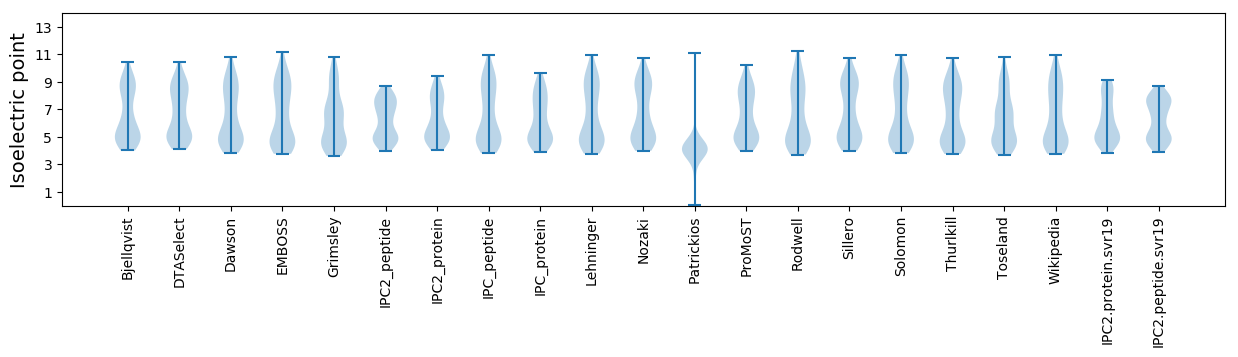
* You can choose from 21 different methods for calculating isoelectric point
Summary statistics related to proteome-wise predictions
Protein with the lowest isoelectric point:
>tr|A0A6B9LS18|A0A6B9LS18_9CAUD Uncharacterized protein OS=Vibrio phage VMJ710 OX=2595040 PE=4 SV=1
MM1 pKa = 7.2VFVGLKK7 pKa = 10.35CFTNKK12 pKa = 10.41GEE14 pKa = 4.5IIIMQNNIDD23 pKa = 3.61VDD25 pKa = 4.32TNEE28 pKa = 4.81HH29 pKa = 6.06LNSRR33 pKa = 11.84YY34 pKa = 9.24IQSFLDD40 pKa = 3.59EE41 pKa = 4.26YY42 pKa = 11.44GFYY45 pKa = 10.9DD46 pKa = 4.02NEE48 pKa = 4.22IFDD51 pKa = 5.0GEE53 pKa = 4.37NFCIWMEE60 pKa = 4.04EE61 pKa = 4.02MM62 pKa = 5.21
MM1 pKa = 7.2VFVGLKK7 pKa = 10.35CFTNKK12 pKa = 10.41GEE14 pKa = 4.5IIIMQNNIDD23 pKa = 3.61VDD25 pKa = 4.32TNEE28 pKa = 4.81HH29 pKa = 6.06LNSRR33 pKa = 11.84YY34 pKa = 9.24IQSFLDD40 pKa = 3.59EE41 pKa = 4.26YY42 pKa = 11.44GFYY45 pKa = 10.9DD46 pKa = 4.02NEE48 pKa = 4.22IFDD51 pKa = 5.0GEE53 pKa = 4.37NFCIWMEE60 pKa = 4.04EE61 pKa = 4.02MM62 pKa = 5.21
Molecular weight: 7.43 kDa
Isoelectric point according different methods:
Protein with the highest isoelectric point:
>tr|A0A6B9LKS5|A0A6B9LKS5_9CAUD Terminase large subunit OS=Vibrio phage VMJ710 OX=2595040 PE=4 SV=1
MM1 pKa = 7.69LRR3 pKa = 11.84RR4 pKa = 11.84QILDD8 pKa = 3.75VIDD11 pKa = 3.77VLVDD15 pKa = 3.46GKK17 pKa = 10.99FVLEE21 pKa = 4.69LKK23 pKa = 8.92NTNLKK28 pKa = 9.1WRR30 pKa = 11.84GSSNQRR36 pKa = 11.84VWKK39 pKa = 10.12LNIMM43 pKa = 4.25
MM1 pKa = 7.69LRR3 pKa = 11.84RR4 pKa = 11.84QILDD8 pKa = 3.75VIDD11 pKa = 3.77VLVDD15 pKa = 3.46GKK17 pKa = 10.99FVLEE21 pKa = 4.69LKK23 pKa = 8.92NTNLKK28 pKa = 9.1WRR30 pKa = 11.84GSSNQRR36 pKa = 11.84VWKK39 pKa = 10.12LNIMM43 pKa = 4.25
Molecular weight: 5.14 kDa
Isoelectric point according different methods:
Peptides (in silico digests for buttom-up proteomics)
Below you can find in silico digests of the whole proteome with Trypsin, Chymotrypsin, Trypsin+LysC, LysN, ArgC proteases suitable for different mass spec machines.| Try ESI |
 |
|---|
| ChTry ESI |
|
|---|
| ArgC ESI |
|
|---|
| LysN ESI |
|
|---|
| TryLysC ESI |
|
|---|
| Try MALDI |
|
|---|
| ChTry MALDI |
|
|---|
| ArgC MALDI |
|
|---|
| LysN MALDI |
|
|---|
| TryLysC MALDI |
|
|---|
| Try LTQ |
|
|---|
| ChTry LTQ |
|
|---|
| ArgC LTQ |
|
|---|
| LysN LTQ |
|
|---|
| TryLysC LTQ |
|
|---|
| Try MSlow |
|
|---|
| ChTry MSlow |
|
|---|
| ArgC MSlow |
|
|---|
| LysN MSlow |
|
|---|
| TryLysC MSlow |
|
|---|
| Try MShigh |
|
|---|
| ChTry MShigh |
|
|---|
| ArgC MShigh |
|
|---|
| LysN MShigh |
|
|---|
| TryLysC MShigh |
|
|---|
General Statistics
Number of major isoforms |
Number of additional isoforms |
Number of all proteins |
Number of amino acids |
Min. Seq. Length |
Max. Seq. Length |
Avg. Seq. Length |
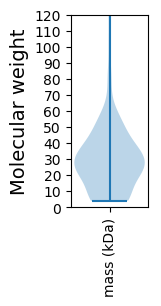
Avg. Mol. Weight |
|---|---|---|---|---|---|---|---|
0 |
23724 |
34 |
1076 |
266.6 |
30.36 |
Amino acid frequency
Ala |
Cys |
Asp |
Glu |
Phe |
Gly |
His |
Ile |
Lys |
Leu |
|---|---|---|---|---|---|---|---|---|---|
5.1 ± 0.287 | 1.737 ± 0.138 |
6.196 ± 0.171 | 7.465 ± 0.22 |
4.375 ± 0.156 | 6.521 ± 0.2 |
1.914 ± 0.097 | 6.154 ± 0.164 |
8.051 ± 0.273 | 8.38 ± 0.245 |
Met |
Asn |
Gln |
Pro |
Arg |
Ser |
Thr |
Val |
Trp |
Tyr |
|---|---|---|---|---|---|---|---|---|---|
2.386 ± 0.143 | 5.21 ± 0.193 |
3.166 ± 0.117 | 3.499 ± 0.162 |
4.354 ± 0.162 | 7.065 ± 0.158 |
5.699 ± 0.257 | 6.803 ± 0.204 |
1.399 ± 0.104 | 4.527 ± 0.197 |
Most of the basic statistics you can see at this page can be downloaded from this CSV file
See this proteome in:

Proteome-pI is available under Creative Commons Attribution-NoDerivs license, for more details see here
| Reference: Kozlowski LP. Proteome-pI 2.0: Proteome Isoelectric Point Database Update. Nucleic Acids Res. 2021, doi: 10.1093/nar/gkab944 | Contact: Lukasz P. Kozlowski |