Cyanophage KBS-S-2A
Taxonomy: Viruses; Duplodnaviria; Heunggongvirae; Uroviricota; Caudoviricetes; Caudovirales; Siphoviridae; unclassified Siphoviridae
Average proteome isoelectric point is 6.3
Get precalculated fractions of proteins
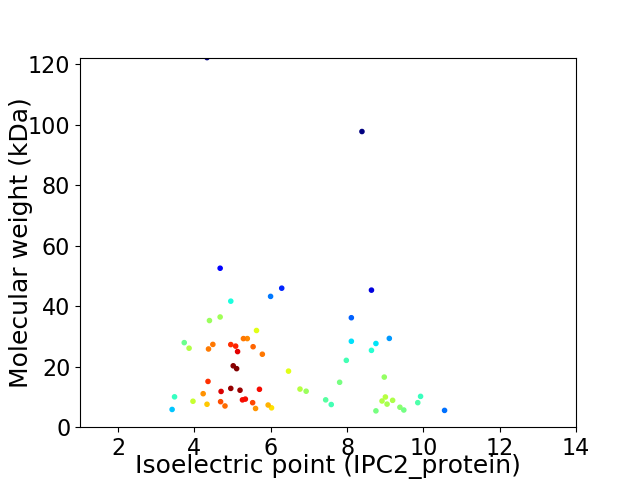
Virtual 2D-PAGE plot for 64 proteins (isoelectric point calculated using IPC2_protein)
Get csv file with sequences according to given criteria:
* You can choose from 21 different methods for calculating isoelectric point
Summary statistics related to proteome-wise predictions
Protein with the lowest isoelectric point:
>tr|M4SNT1|M4SNT1_9CAUD Uncharacterized protein OS=Cyanophage KBS-S-2A OX=889953 GN=CPKG_00052 PE=4 SV=1
MM1 pKa = 7.62SDD3 pKa = 3.09EE4 pKa = 4.98PIRR7 pKa = 11.84FIASDD12 pKa = 3.61NQSEE16 pKa = 4.69YY17 pKa = 11.04VSPGTPLPVALTGLEE32 pKa = 4.31IPAHH36 pKa = 6.67DD37 pKa = 5.29YY38 pKa = 11.24IDD40 pKa = 3.97LSYY43 pKa = 10.57TGSNLTSVVYY53 pKa = 10.55KK54 pKa = 10.74DD55 pKa = 3.69GGSGGTTVATLTLAYY70 pKa = 10.23DD71 pKa = 4.0GNDD74 pKa = 3.02NLISVTKK81 pKa = 10.49SS82 pKa = 2.74
MM1 pKa = 7.62SDD3 pKa = 3.09EE4 pKa = 4.98PIRR7 pKa = 11.84FIASDD12 pKa = 3.61NQSEE16 pKa = 4.69YY17 pKa = 11.04VSPGTPLPVALTGLEE32 pKa = 4.31IPAHH36 pKa = 6.67DD37 pKa = 5.29YY38 pKa = 11.24IDD40 pKa = 3.97LSYY43 pKa = 10.57TGSNLTSVVYY53 pKa = 10.55KK54 pKa = 10.74DD55 pKa = 3.69GGSGGTTVATLTLAYY70 pKa = 10.23DD71 pKa = 4.0GNDD74 pKa = 3.02NLISVTKK81 pKa = 10.49SS82 pKa = 2.74
Molecular weight: 8.58 kDa
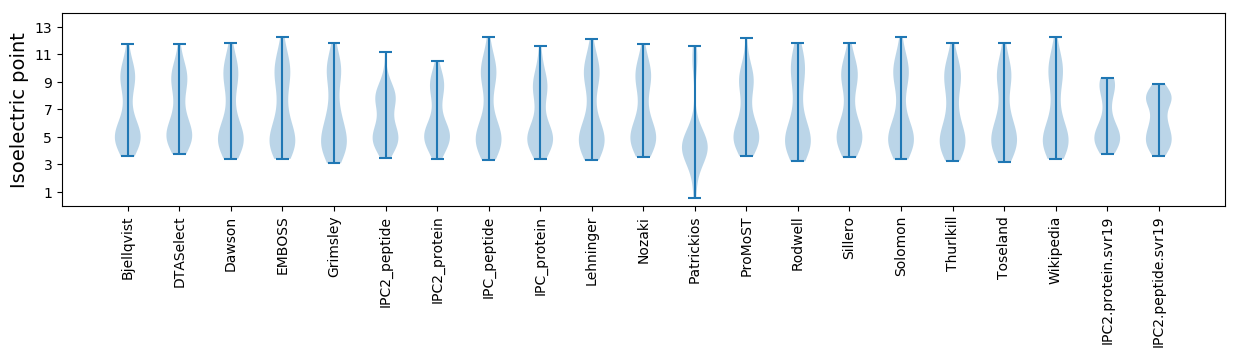
Isoelectric point according different methods:
Protein with the highest isoelectric point:
>tr|M4SMT6|M4SMT6_9CAUD Uncharacterized protein OS=Cyanophage KBS-S-2A OX=889953 GN=CPKG_00046 PE=4 SV=1
MM1 pKa = 7.36KK2 pKa = 10.47RR3 pKa = 11.84GDD5 pKa = 3.71RR6 pKa = 11.84VSWTYY11 pKa = 9.88QGKK14 pKa = 7.98RR15 pKa = 11.84TYY17 pKa = 11.13GVITSIGGKK26 pKa = 9.36RR27 pKa = 11.84ATINTTSGGTVTRR40 pKa = 11.84VGTDD44 pKa = 2.82DD45 pKa = 3.82DD46 pKa = 4.26QIVRR50 pKa = 11.84IKK52 pKa = 10.81SEE54 pKa = 4.16STGNPVLKK62 pKa = 9.99LQSEE66 pKa = 4.72IKK68 pKa = 9.6PAPKK72 pKa = 9.94RR73 pKa = 11.84RR74 pKa = 3.53
MM1 pKa = 7.36KK2 pKa = 10.47RR3 pKa = 11.84GDD5 pKa = 3.71RR6 pKa = 11.84VSWTYY11 pKa = 9.88QGKK14 pKa = 7.98RR15 pKa = 11.84TYY17 pKa = 11.13GVITSIGGKK26 pKa = 9.36RR27 pKa = 11.84ATINTTSGGTVTRR40 pKa = 11.84VGTDD44 pKa = 2.82DD45 pKa = 3.82DD46 pKa = 4.26QIVRR50 pKa = 11.84IKK52 pKa = 10.81SEE54 pKa = 4.16STGNPVLKK62 pKa = 9.99LQSEE66 pKa = 4.72IKK68 pKa = 9.6PAPKK72 pKa = 9.94RR73 pKa = 11.84RR74 pKa = 3.53
Molecular weight: 8.12 kDa
Isoelectric point according different methods:
Peptides (in silico digests for buttom-up proteomics)
Below you can find in silico digests of the whole proteome with Trypsin, Chymotrypsin, Trypsin+LysC, LysN, ArgC proteases suitable for different mass spec machines.| Try ESI |
 |
|---|
| ChTry ESI |
|
|---|
| ArgC ESI |
|
|---|
| LysN ESI |
|
|---|
| TryLysC ESI |
|
|---|
| Try MALDI |
|
|---|
| ChTry MALDI |
|
|---|
| ArgC MALDI |
|
|---|
| LysN MALDI |
|
|---|
| TryLysC MALDI |
|
|---|
| Try LTQ |
|
|---|
| ChTry LTQ |
|
|---|
| ArgC LTQ |
|
|---|
| LysN LTQ |
|
|---|
| TryLysC LTQ |
|
|---|
| Try MSlow |
|
|---|
| ChTry MSlow |
|
|---|
| ArgC MSlow |
|
|---|
| LysN MSlow |
|
|---|
| TryLysC MSlow |
|
|---|
| Try MShigh |
|
|---|
| ChTry MShigh |
|
|---|
| ArgC MShigh |
|
|---|
| LysN MShigh |
|
|---|
| TryLysC MShigh |
|
|---|
General Statistics
Number of major isoforms |
Number of additional isoforms |
Number of all proteins |
Number of amino acids |
Min. Seq. Length |
Max. Seq. Length |
Avg. Seq. Length |
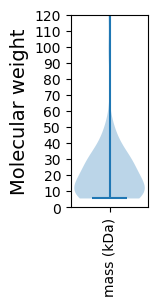
Avg. Mol. Weight |
|---|---|---|---|---|---|---|---|
0 |
12716 |
49 |
1107 |
198.7 |
21.8 |
Amino acid frequency
Ala |
Cys |
Asp |
Glu |
Phe |
Gly |
His |
Ile |
Lys |
Leu |
|---|---|---|---|---|---|---|---|---|---|
10.082 ± 0.494 | 0.952 ± 0.148 |
5.937 ± 0.334 | 5.646 ± 0.354 |
3.295 ± 0.15 | 7.534 ± 0.409 |
1.486 ± 0.183 | 5.859 ± 0.2 |
4.53 ± 0.39 | 8.163 ± 0.349 |
Met |
Asn |
Gln |
Pro |
Arg |
Ser |
Thr |
Val |
Trp |
Tyr |
|---|---|---|---|---|---|---|---|---|---|
1.699 ± 0.169 | 4.412 ± 0.205 |
4.451 ± 0.283 | 4.852 ± 0.227 |
5.568 ± 0.358 | 6.763 ± 0.355 |
7.793 ± 0.461 | 6.283 ± 0.314 |
1.4 ± 0.151 | 3.295 ± 0.247 |
Most of the basic statistics you can see at this page can be downloaded from this CSV file
See this proteome in:

Proteome-pI is available under Creative Commons Attribution-NoDerivs license, for more details see here
| Reference: Kozlowski LP. Proteome-pI 2.0: Proteome Isoelectric Point Database Update. Nucleic Acids Res. 2021, doi: 10.1093/nar/gkab944 | Contact: Lukasz P. Kozlowski |