Novipirellula galeiformis
Taxonomy: cellular organisms; Bacteria; PVC group; Planctomycetes; Planctomycetia; Pirellulales; Pirellulaceae; Novipirellula
Average proteome isoelectric point is 6.3
Get precalculated fractions of proteins
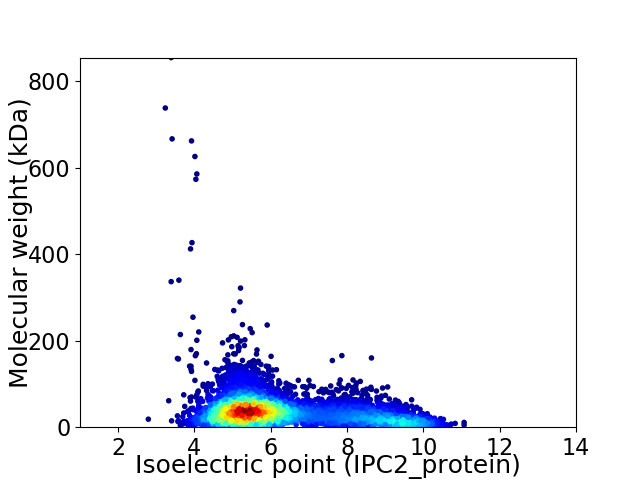
Virtual 2D-PAGE plot for 5747 proteins (isoelectric point calculated using IPC2_protein)
Get csv file with sequences according to given criteria:
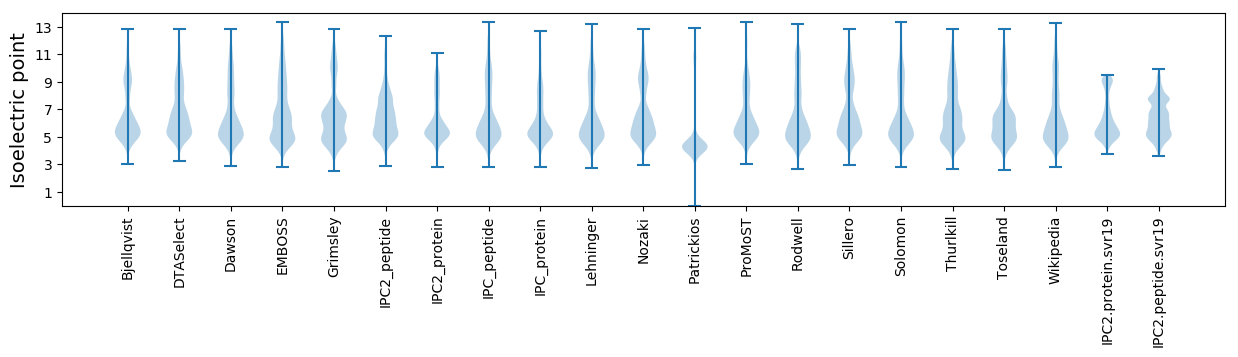
* You can choose from 21 different methods for calculating isoelectric point
Summary statistics related to proteome-wise predictions
Protein with the lowest isoelectric point:
>tr|A0A5C6CBW5|A0A5C6CBW5_9BACT Uncharacterized protein OS=Novipirellula galeiformis OX=2528004 GN=Pla52o_37120 PE=4 SV=1
MM1 pKa = 7.62GSSQYY6 pKa = 11.27SILTDD11 pKa = 3.62EE12 pKa = 4.61SWISDD17 pKa = 3.53VPSAEE22 pKa = 3.75KK23 pKa = 10.15TRR25 pKa = 11.84FDD27 pKa = 4.25MIIPYY32 pKa = 9.41WGTNTDD38 pKa = 3.8DD39 pKa = 4.33AGCVYY44 pKa = 10.56QGISDD49 pKa = 3.92GRR51 pKa = 11.84NASIQAFYY59 pKa = 10.23QASNIDD65 pKa = 3.3EE66 pKa = 4.54RR67 pKa = 11.84YY68 pKa = 10.15EE69 pKa = 3.84NN70 pKa = 3.79
MM1 pKa = 7.62GSSQYY6 pKa = 11.27SILTDD11 pKa = 3.62EE12 pKa = 4.61SWISDD17 pKa = 3.53VPSAEE22 pKa = 3.75KK23 pKa = 10.15TRR25 pKa = 11.84FDD27 pKa = 4.25MIIPYY32 pKa = 9.41WGTNTDD38 pKa = 3.8DD39 pKa = 4.33AGCVYY44 pKa = 10.56QGISDD49 pKa = 3.92GRR51 pKa = 11.84NASIQAFYY59 pKa = 10.23QASNIDD65 pKa = 3.3EE66 pKa = 4.54RR67 pKa = 11.84YY68 pKa = 10.15EE69 pKa = 3.84NN70 pKa = 3.79
Molecular weight: 7.88 kDa
Isoelectric point according different methods:
Protein with the highest isoelectric point:
>tr|A0A5C6CM81|A0A5C6CM81_9BACT 31-O-demethyl-FK506 methyltransferase FkbM OS=Novipirellula galeiformis OX=2528004 GN=fkbM PE=4 SV=1
MM1 pKa = 7.16IHH3 pKa = 7.09RR4 pKa = 11.84LRR6 pKa = 11.84RR7 pKa = 11.84LRR9 pKa = 11.84RR10 pKa = 11.84VSALRR15 pKa = 11.84FALGGALHH23 pKa = 6.61LTPNTPNRR31 pKa = 11.84MRR33 pKa = 11.84PNHH36 pKa = 5.13VPAWSMVV43 pKa = 2.99
MM1 pKa = 7.16IHH3 pKa = 7.09RR4 pKa = 11.84LRR6 pKa = 11.84RR7 pKa = 11.84LRR9 pKa = 11.84RR10 pKa = 11.84VSALRR15 pKa = 11.84FALGGALHH23 pKa = 6.61LTPNTPNRR31 pKa = 11.84MRR33 pKa = 11.84PNHH36 pKa = 5.13VPAWSMVV43 pKa = 2.99
Molecular weight: 5.0 kDa
Isoelectric point according different methods:
Peptides (in silico digests for buttom-up proteomics)
Below you can find in silico digests of the whole proteome with Trypsin, Chymotrypsin, Trypsin+LysC, LysN, ArgC proteases suitable for different mass spec machines.| Try ESI |
 |
|---|
| ChTry ESI |
|
|---|
| ArgC ESI |
|
|---|
| LysN ESI |
|
|---|
| TryLysC ESI |
|
|---|
| Try MALDI |
|
|---|
| ChTry MALDI |
|
|---|
| ArgC MALDI |
|
|---|
| LysN MALDI |
|
|---|
| TryLysC MALDI |
|
|---|
| Try LTQ |
|
|---|
| ChTry LTQ |
|
|---|
| ArgC LTQ |
|
|---|
| LysN LTQ |
|
|---|
| TryLysC LTQ |
|
|---|
| Try MSlow |
|
|---|
| ChTry MSlow |
|
|---|
| ArgC MSlow |
|
|---|
| LysN MSlow |
|
|---|
| TryLysC MSlow |
|
|---|
| Try MShigh |
|
|---|
| ChTry MShigh |
|
|---|
| ArgC MShigh |
|
|---|
| LysN MShigh |
|
|---|
| TryLysC MShigh |
|
|---|
General Statistics
Number of major isoforms |
Number of additional isoforms |
Number of all proteins |
Number of amino acids |
Min. Seq. Length |
Max. Seq. Length |
Avg. Seq. Length |
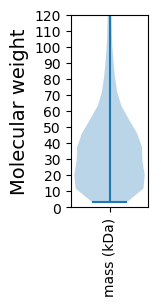
Avg. Mol. Weight |
|---|---|---|---|---|---|---|---|
0 |
2082698 |
29 |
8578 |
362.4 |
39.8 |
Amino acid frequency
Ala |
Cys |
Asp |
Glu |
Phe |
Gly |
His |
Ile |
Lys |
Leu |
|---|---|---|---|---|---|---|---|---|---|
9.942 ± 0.033 | 1.141 ± 0.016 |
6.093 ± 0.033 | 5.939 ± 0.036 |
3.65 ± 0.022 | 7.587 ± 0.05 |
2.314 ± 0.022 | 5.2 ± 0.018 |
3.497 ± 0.036 | 9.523 ± 0.039 |
Met |
Asn |
Gln |
Pro |
Arg |
Ser |
Thr |
Val |
Trp |
Tyr |
|---|---|---|---|---|---|---|---|---|---|
2.326 ± 0.022 | 3.285 ± 0.039 |
5.158 ± 0.031 | 4.055 ± 0.025 |
6.63 ± 0.047 | 6.885 ± 0.035 |
5.772 ± 0.07 | 7.232 ± 0.031 |
1.441 ± 0.015 | 2.331 ± 0.017 |
Most of the basic statistics you can see at this page can be downloaded from this CSV file
See this proteome in:

Proteome-pI is available under Creative Commons Attribution-NoDerivs license, for more details see here
| Reference: Kozlowski LP. Proteome-pI 2.0: Proteome Isoelectric Point Database Update. Nucleic Acids Res. 2021, doi: 10.1093/nar/gkab944 | Contact: Lukasz P. Kozlowski |