Xanthomonas phage Xp15
Taxonomy: Viruses; Duplodnaviria; Heunggongvirae; Uroviricota; Caudoviricetes; Caudovirales; Siphoviridae; Alachuavirus; Xanthomonas virus Xp15
Average proteome isoelectric point is 6.74
Get precalculated fractions of proteins
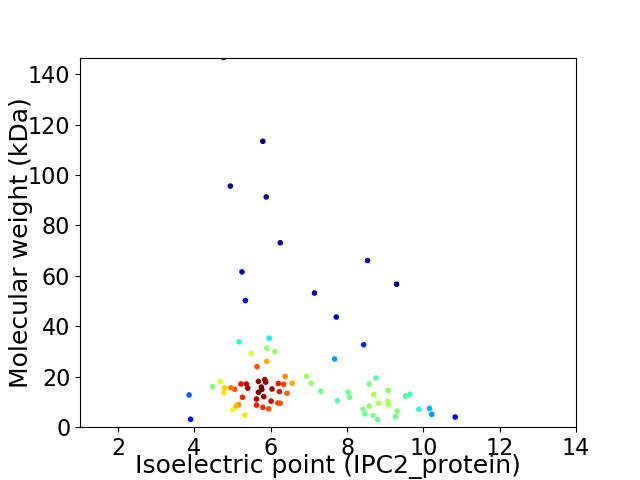
Virtual 2D-PAGE plot for 84 proteins (isoelectric point calculated using IPC2_protein)
Get csv file with sequences according to given criteria:
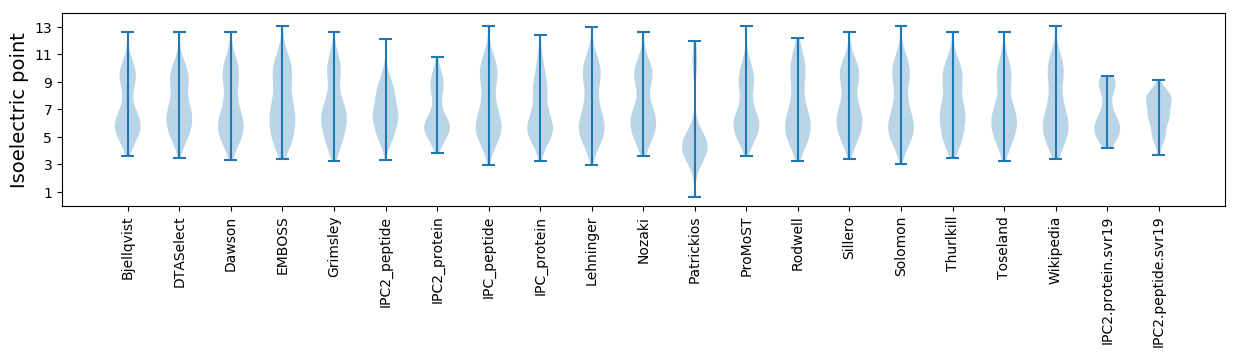
* You can choose from 21 different methods for calculating isoelectric point
Summary statistics related to proteome-wise predictions
Protein with the lowest isoelectric point:
>tr|Q52PR6|Q52PR6_9CAUD Possible translation initiation factor OS=Xanthomonas phage Xp15 OX=322855 PE=4 SV=1
MM1 pKa = 7.67SSPDD5 pKa = 3.41NEE7 pKa = 4.73LNLHH11 pKa = 6.87LATEE15 pKa = 4.6DD16 pKa = 3.51ASDD19 pKa = 3.98AKK21 pKa = 10.92NEE23 pKa = 4.14RR24 pKa = 11.84ADD26 pKa = 3.8EE27 pKa = 5.25LIQEE31 pKa = 4.21WMKK34 pKa = 11.18NPSTVAEE41 pKa = 4.59WISAVLDD48 pKa = 3.89EE49 pKa = 4.71QSQARR54 pKa = 11.84DD55 pKa = 3.25DD56 pKa = 4.21FAALLAEE63 pKa = 5.63AITVDD68 pKa = 4.61DD69 pKa = 3.81YY70 pKa = 12.1DD71 pKa = 3.58RR72 pKa = 11.84CKK74 pKa = 10.6EE75 pKa = 4.07ALGEE79 pKa = 4.07ALDD82 pKa = 4.91LIEE85 pKa = 4.11THH87 pKa = 6.43VMYY90 pKa = 10.73EE91 pKa = 3.86MRR93 pKa = 11.84GDD95 pKa = 3.64ALAEE99 pKa = 4.34LEE101 pKa = 4.49SQSNPLPPEE110 pKa = 4.18SVDD113 pKa = 5.06LII115 pKa = 4.3
MM1 pKa = 7.67SSPDD5 pKa = 3.41NEE7 pKa = 4.73LNLHH11 pKa = 6.87LATEE15 pKa = 4.6DD16 pKa = 3.51ASDD19 pKa = 3.98AKK21 pKa = 10.92NEE23 pKa = 4.14RR24 pKa = 11.84ADD26 pKa = 3.8EE27 pKa = 5.25LIQEE31 pKa = 4.21WMKK34 pKa = 11.18NPSTVAEE41 pKa = 4.59WISAVLDD48 pKa = 3.89EE49 pKa = 4.71QSQARR54 pKa = 11.84DD55 pKa = 3.25DD56 pKa = 4.21FAALLAEE63 pKa = 5.63AITVDD68 pKa = 4.61DD69 pKa = 3.81YY70 pKa = 12.1DD71 pKa = 3.58RR72 pKa = 11.84CKK74 pKa = 10.6EE75 pKa = 4.07ALGEE79 pKa = 4.07ALDD82 pKa = 4.91LIEE85 pKa = 4.11THH87 pKa = 6.43VMYY90 pKa = 10.73EE91 pKa = 3.86MRR93 pKa = 11.84GDD95 pKa = 3.64ALAEE99 pKa = 4.34LEE101 pKa = 4.49SQSNPLPPEE110 pKa = 4.18SVDD113 pKa = 5.06LII115 pKa = 4.3
Molecular weight: 12.79 kDa
Isoelectric point according different methods:
Protein with the highest isoelectric point:
>tr|Q52PS9|Q52PS9_9CAUD Uncharacterized protein OS=Xanthomonas phage Xp15 OX=322855 PE=4 SV=1
MM1 pKa = 7.46PWAPPSARR9 pKa = 11.84STTSARR15 pKa = 11.84TATSPTSPPTSSRR28 pKa = 11.84PKK30 pKa = 9.36PRR32 pKa = 11.84RR33 pKa = 11.84PTASSGG39 pKa = 3.28
MM1 pKa = 7.46PWAPPSARR9 pKa = 11.84STTSARR15 pKa = 11.84TATSPTSPPTSSRR28 pKa = 11.84PKK30 pKa = 9.36PRR32 pKa = 11.84RR33 pKa = 11.84PTASSGG39 pKa = 3.28
Molecular weight: 4.02 kDa
Isoelectric point according different methods:
Peptides (in silico digests for buttom-up proteomics)
Below you can find in silico digests of the whole proteome with Trypsin, Chymotrypsin, Trypsin+LysC, LysN, ArgC proteases suitable for different mass spec machines.| Try ESI |
 |
|---|
| ChTry ESI |
|
|---|
| ArgC ESI |
|
|---|
| LysN ESI |
|
|---|
| TryLysC ESI |
|
|---|
| Try MALDI |
|
|---|
| ChTry MALDI |
|
|---|
| ArgC MALDI |
|
|---|
| LysN MALDI |
|
|---|
| TryLysC MALDI |
|
|---|
| Try LTQ |
|
|---|
| ChTry LTQ |
|
|---|
| ArgC LTQ |
|
|---|
| LysN LTQ |
|
|---|
| TryLysC LTQ |
|
|---|
| Try MSlow |
|
|---|
| ChTry MSlow |
|
|---|
| ArgC MSlow |
|
|---|
| LysN MSlow |
|
|---|
| TryLysC MSlow |
|
|---|
| Try MShigh |
|
|---|
| ChTry MShigh |
|
|---|
| ArgC MShigh |
|
|---|
| LysN MShigh |
|
|---|
| TryLysC MShigh |
|
|---|
General Statistics
Number of major isoforms |
Number of additional isoforms |
Number of all proteins |
Number of amino acids |
Min. Seq. Length |
Max. Seq. Length |
Avg. Seq. Length |
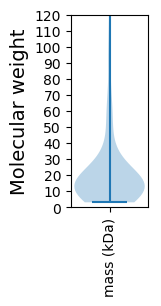
Avg. Mol. Weight |
|---|---|---|---|---|---|---|---|
0 |
17016 |
26 |
1339 |
202.6 |
22.56 |
Amino acid frequency
Ala |
Cys |
Asp |
Glu |
Phe |
Gly |
His |
Ile |
Lys |
Leu |
|---|---|---|---|---|---|---|---|---|---|
8.398 ± 0.415 | 1.046 ± 0.127 |
5.536 ± 0.157 | 5.73 ± 0.278 |
3.873 ± 0.164 | 7.405 ± 0.359 |
2.039 ± 0.205 | 5.959 ± 0.198 |
5.389 ± 0.354 | 8.128 ± 0.254 |
Met |
Asn |
Gln |
Pro |
Arg |
Ser |
Thr |
Val |
Trp |
Tyr |
|---|---|---|---|---|---|---|---|---|---|
3.209 ± 0.187 | 4.408 ± 0.197 |
4.402 ± 0.269 | 3.89 ± 0.131 |
5.448 ± 0.22 | 6.858 ± 0.234 |
6.177 ± 0.254 | 6.888 ± 0.266 |
1.628 ± 0.122 | 3.555 ± 0.162 |
Most of the basic statistics you can see at this page can be downloaded from this CSV file
See this proteome in:

Proteome-pI is available under Creative Commons Attribution-NoDerivs license, for more details see here
| Reference: Kozlowski LP. Proteome-pI 2.0: Proteome Isoelectric Point Database Update. Nucleic Acids Res. 2021, doi: 10.1093/nar/gkab944 | Contact: Lukasz P. Kozlowski |