Micromonospora sp. Llam0
Taxonomy: cellular organisms; Bacteria; Terrabacteria group; Actinobacteria; Actinomycetia; Micromonosporales; Micromonosporaceae; Micromonospora; unclassified Micromonospora
Average proteome isoelectric point is 6.56
Get precalculated fractions of proteins
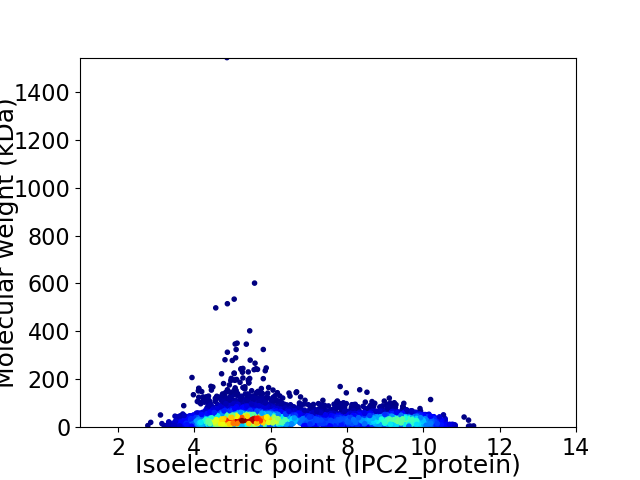
Virtual 2D-PAGE plot for 7541 proteins (isoelectric point calculated using IPC2_protein)
Get csv file with sequences according to given criteria:
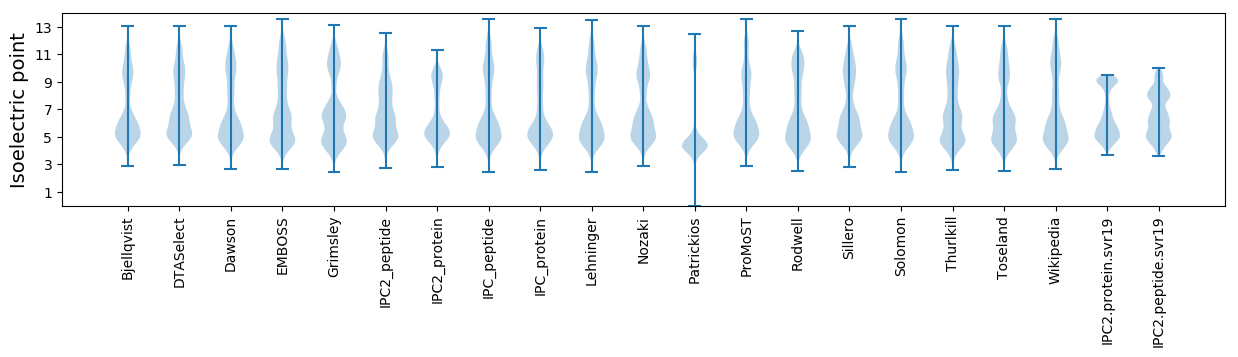
* You can choose from 21 different methods for calculating isoelectric point
Summary statistics related to proteome-wise predictions
Protein with the lowest isoelectric point:
>tr|A0A3N1B2S3|A0A3N1B2S3_9ACTN DNA-binding XRE family transcriptional regulator OS=Micromonospora sp. Llam0 OX=2485143 GN=EDC02_5069 PE=4 SV=1
MM1 pKa = 7.45LNAAGWGRR9 pKa = 11.84LGAGTLLAGALVVAAAAPAAAQNPGPDD36 pKa = 3.55LFVSFDD42 pKa = 3.79RR43 pKa = 11.84EE44 pKa = 3.95PVAEE48 pKa = 4.06VDD50 pKa = 3.5NSGVTLGMYY59 pKa = 9.58VYY61 pKa = 10.74NYY63 pKa = 10.34GDD65 pKa = 3.79APASDD70 pKa = 3.57VTIVVDD76 pKa = 3.48ATGVDD81 pKa = 3.9DD82 pKa = 5.36AVQLAEE88 pKa = 5.15GYY90 pKa = 10.48HH91 pKa = 6.22PGCEE95 pKa = 3.6ITDD98 pKa = 3.6RR99 pKa = 11.84VVTCAYY105 pKa = 9.39GALAAGLTDD114 pKa = 4.14HH115 pKa = 7.46IYY117 pKa = 10.17PVRR120 pKa = 11.84LASRR124 pKa = 11.84AGATPGDD131 pKa = 4.3AGTMTVTISSAEE143 pKa = 3.84QDD145 pKa = 3.9ANPADD150 pKa = 3.81NTTTFPVTVLASGPDD165 pKa = 3.7LVALVDD171 pKa = 5.66DD172 pKa = 5.03INTEE176 pKa = 3.83QDD178 pKa = 2.92RR179 pKa = 11.84VGPGDD184 pKa = 3.59TAPLYY189 pKa = 10.79AAVLNEE195 pKa = 4.2GDD197 pKa = 4.02STADD201 pKa = 3.06SYY203 pKa = 11.73TIGLDD208 pKa = 3.23LPTGVGFVDD217 pKa = 5.25EE218 pKa = 4.82YY219 pKa = 10.97TDD221 pKa = 4.25CDD223 pKa = 4.48YY224 pKa = 11.34ISYY227 pKa = 9.12WPNDD231 pKa = 3.86PKK233 pKa = 11.08TEE235 pKa = 4.07GYY237 pKa = 10.71AYY239 pKa = 10.02GPSRR243 pKa = 11.84VTCALTIPLAPGEE256 pKa = 4.26TLFLVDD262 pKa = 4.14EE263 pKa = 4.39QGEE266 pKa = 4.77SLFDD270 pKa = 4.03LYY272 pKa = 11.05FGNNLAGPDD281 pKa = 3.49QTSGSFEE288 pKa = 3.96ARR290 pKa = 11.84LVADD294 pKa = 5.6DD295 pKa = 4.37PAQAQARR302 pKa = 11.84ASTAGGKK309 pKa = 9.79SINEE313 pKa = 3.96ALANAQAAAARR324 pKa = 11.84SAGRR328 pKa = 11.84SAASLLEE335 pKa = 4.65EE336 pKa = 5.35IDD338 pKa = 3.72TEE340 pKa = 4.99DD341 pKa = 3.4NVDD344 pKa = 3.47YY345 pKa = 10.42FAVHH349 pKa = 6.3TKK351 pKa = 10.59PNTFDD356 pKa = 3.18IAVTAEE362 pKa = 4.26PVTGEE367 pKa = 3.87PGEE370 pKa = 4.41TVDD373 pKa = 4.89LTFTVVNNGPSDD385 pKa = 3.56GSGPGVTVTAPSGTVLLPSDD405 pKa = 3.06WCYY408 pKa = 11.11TEE410 pKa = 5.82GEE412 pKa = 4.31PGTRR416 pKa = 11.84LPEE419 pKa = 4.4SPALRR424 pKa = 11.84CNFEE428 pKa = 4.89SIFPATASGGGQITHH443 pKa = 6.54TLQLKK448 pKa = 10.07IEE450 pKa = 4.39STPGTDD456 pKa = 3.27GTIVADD462 pKa = 3.59SGGPSTEE469 pKa = 4.2SDD471 pKa = 3.19PSNNTVAIVFTGAGDD486 pKa = 4.48DD487 pKa = 4.41PDD489 pKa = 5.33DD490 pKa = 4.17EE491 pKa = 5.72PGGGGAGDD499 pKa = 4.05GDD501 pKa = 4.2EE502 pKa = 5.05LPITGASVGTVVGVGAVAVALGVALLLTVRR532 pKa = 11.84RR533 pKa = 11.84RR534 pKa = 11.84ATVTVSAPEE543 pKa = 3.6
MM1 pKa = 7.45LNAAGWGRR9 pKa = 11.84LGAGTLLAGALVVAAAAPAAAQNPGPDD36 pKa = 3.55LFVSFDD42 pKa = 3.79RR43 pKa = 11.84EE44 pKa = 3.95PVAEE48 pKa = 4.06VDD50 pKa = 3.5NSGVTLGMYY59 pKa = 9.58VYY61 pKa = 10.74NYY63 pKa = 10.34GDD65 pKa = 3.79APASDD70 pKa = 3.57VTIVVDD76 pKa = 3.48ATGVDD81 pKa = 3.9DD82 pKa = 5.36AVQLAEE88 pKa = 5.15GYY90 pKa = 10.48HH91 pKa = 6.22PGCEE95 pKa = 3.6ITDD98 pKa = 3.6RR99 pKa = 11.84VVTCAYY105 pKa = 9.39GALAAGLTDD114 pKa = 4.14HH115 pKa = 7.46IYY117 pKa = 10.17PVRR120 pKa = 11.84LASRR124 pKa = 11.84AGATPGDD131 pKa = 4.3AGTMTVTISSAEE143 pKa = 3.84QDD145 pKa = 3.9ANPADD150 pKa = 3.81NTTTFPVTVLASGPDD165 pKa = 3.7LVALVDD171 pKa = 5.66DD172 pKa = 5.03INTEE176 pKa = 3.83QDD178 pKa = 2.92RR179 pKa = 11.84VGPGDD184 pKa = 3.59TAPLYY189 pKa = 10.79AAVLNEE195 pKa = 4.2GDD197 pKa = 4.02STADD201 pKa = 3.06SYY203 pKa = 11.73TIGLDD208 pKa = 3.23LPTGVGFVDD217 pKa = 5.25EE218 pKa = 4.82YY219 pKa = 10.97TDD221 pKa = 4.25CDD223 pKa = 4.48YY224 pKa = 11.34ISYY227 pKa = 9.12WPNDD231 pKa = 3.86PKK233 pKa = 11.08TEE235 pKa = 4.07GYY237 pKa = 10.71AYY239 pKa = 10.02GPSRR243 pKa = 11.84VTCALTIPLAPGEE256 pKa = 4.26TLFLVDD262 pKa = 4.14EE263 pKa = 4.39QGEE266 pKa = 4.77SLFDD270 pKa = 4.03LYY272 pKa = 11.05FGNNLAGPDD281 pKa = 3.49QTSGSFEE288 pKa = 3.96ARR290 pKa = 11.84LVADD294 pKa = 5.6DD295 pKa = 4.37PAQAQARR302 pKa = 11.84ASTAGGKK309 pKa = 9.79SINEE313 pKa = 3.96ALANAQAAAARR324 pKa = 11.84SAGRR328 pKa = 11.84SAASLLEE335 pKa = 4.65EE336 pKa = 5.35IDD338 pKa = 3.72TEE340 pKa = 4.99DD341 pKa = 3.4NVDD344 pKa = 3.47YY345 pKa = 10.42FAVHH349 pKa = 6.3TKK351 pKa = 10.59PNTFDD356 pKa = 3.18IAVTAEE362 pKa = 4.26PVTGEE367 pKa = 3.87PGEE370 pKa = 4.41TVDD373 pKa = 4.89LTFTVVNNGPSDD385 pKa = 3.56GSGPGVTVTAPSGTVLLPSDD405 pKa = 3.06WCYY408 pKa = 11.11TEE410 pKa = 5.82GEE412 pKa = 4.31PGTRR416 pKa = 11.84LPEE419 pKa = 4.4SPALRR424 pKa = 11.84CNFEE428 pKa = 4.89SIFPATASGGGQITHH443 pKa = 6.54TLQLKK448 pKa = 10.07IEE450 pKa = 4.39STPGTDD456 pKa = 3.27GTIVADD462 pKa = 3.59SGGPSTEE469 pKa = 4.2SDD471 pKa = 3.19PSNNTVAIVFTGAGDD486 pKa = 4.48DD487 pKa = 4.41PDD489 pKa = 5.33DD490 pKa = 4.17EE491 pKa = 5.72PGGGGAGDD499 pKa = 4.05GDD501 pKa = 4.2EE502 pKa = 5.05LPITGASVGTVVGVGAVAVALGVALLLTVRR532 pKa = 11.84RR533 pKa = 11.84RR534 pKa = 11.84ATVTVSAPEE543 pKa = 3.6
Molecular weight: 55.05 kDa
Isoelectric point according different methods:
Protein with the highest isoelectric point:
>tr|A0A3N1A7I6|A0A3N1A7I6_9ACTN Uncharacterized protein DUF4192 OS=Micromonospora sp. Llam0 OX=2485143 GN=EDC02_7697 PE=4 SV=1
MM1 pKa = 7.69SKK3 pKa = 9.0RR4 pKa = 11.84TFQPNNRR11 pKa = 11.84RR12 pKa = 11.84RR13 pKa = 11.84AKK15 pKa = 8.7THH17 pKa = 5.15GFRR20 pKa = 11.84LRR22 pKa = 11.84MRR24 pKa = 11.84TRR26 pKa = 11.84AGRR29 pKa = 11.84AILSTRR35 pKa = 11.84RR36 pKa = 11.84AKK38 pKa = 10.47GRR40 pKa = 11.84ARR42 pKa = 11.84LSAA45 pKa = 3.91
MM1 pKa = 7.69SKK3 pKa = 9.0RR4 pKa = 11.84TFQPNNRR11 pKa = 11.84RR12 pKa = 11.84RR13 pKa = 11.84AKK15 pKa = 8.7THH17 pKa = 5.15GFRR20 pKa = 11.84LRR22 pKa = 11.84MRR24 pKa = 11.84TRR26 pKa = 11.84AGRR29 pKa = 11.84AILSTRR35 pKa = 11.84RR36 pKa = 11.84AKK38 pKa = 10.47GRR40 pKa = 11.84ARR42 pKa = 11.84LSAA45 pKa = 3.91
Molecular weight: 5.3 kDa
Isoelectric point according different methods:
Peptides (in silico digests for buttom-up proteomics)
Below you can find in silico digests of the whole proteome with Trypsin, Chymotrypsin, Trypsin+LysC, LysN, ArgC proteases suitable for different mass spec machines.| Try ESI |
 |
|---|
| ChTry ESI |
|
|---|
| ArgC ESI |
|
|---|
| LysN ESI |
|
|---|
| TryLysC ESI |
|
|---|
| Try MALDI |
|
|---|
| ChTry MALDI |
|
|---|
| ArgC MALDI |
|
|---|
| LysN MALDI |
|
|---|
| TryLysC MALDI |
|
|---|
| Try LTQ |
|
|---|
| ChTry LTQ |
|
|---|
| ArgC LTQ |
|
|---|
| LysN LTQ |
|
|---|
| TryLysC LTQ |
|
|---|
| Try MSlow |
|
|---|
| ChTry MSlow |
|
|---|
| ArgC MSlow |
|
|---|
| LysN MSlow |
|
|---|
| TryLysC MSlow |
|
|---|
| Try MShigh |
|
|---|
| ChTry MShigh |
|
|---|
| ArgC MShigh |
|
|---|
| LysN MShigh |
|
|---|
| TryLysC MShigh |
|
|---|
General Statistics
Number of major isoforms |
Number of additional isoforms |
Number of all proteins |
Number of amino acids |
Min. Seq. Length |
Max. Seq. Length |
Avg. Seq. Length |
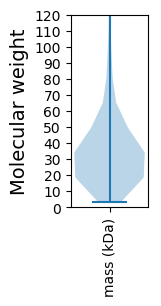
Avg. Mol. Weight |
|---|---|---|---|---|---|---|---|
0 |
2555137 |
29 |
14379 |
338.8 |
36.26 |
Amino acid frequency
Ala |
Cys |
Asp |
Glu |
Phe |
Gly |
His |
Ile |
Lys |
Leu |
|---|---|---|---|---|---|---|---|---|---|
13.791 ± 0.049 | 0.799 ± 0.01 |
6.479 ± 0.023 | 4.702 ± 0.025 |
2.59 ± 0.016 | 9.241 ± 0.029 |
2.224 ± 0.014 | 3.323 ± 0.016 |
1.369 ± 0.018 | 10.207 ± 0.04 |
Met |
Asn |
Gln |
Pro |
Arg |
Ser |
Thr |
Val |
Trp |
Tyr |
|---|---|---|---|---|---|---|---|---|---|
1.606 ± 0.01 | 1.764 ± 0.016 |
6.43 ± 0.028 | 3.035 ± 0.015 |
8.575 ± 0.03 | 4.895 ± 0.019 |
6.356 ± 0.028 | 8.889 ± 0.029 |
1.621 ± 0.012 | 2.102 ± 0.016 |
Most of the basic statistics you can see at this page can be downloaded from this CSV file
See this proteome in:

Proteome-pI is available under Creative Commons Attribution-NoDerivs license, for more details see here
| Reference: Kozlowski LP. Proteome-pI 2.0: Proteome Isoelectric Point Database Update. Nucleic Acids Res. 2021, doi: 10.1093/nar/gkab944 | Contact: Lukasz P. Kozlowski |