Campylobacter virus NCTC12673
Taxonomy: Viruses; Duplodnaviria; Heunggongvirae; Uroviricota; Caudoviricetes; Caudovirales; Myoviridae; Eucampyvirinae; Fletchervirus
Average proteome isoelectric point is 6.31
Get precalculated fractions of proteins
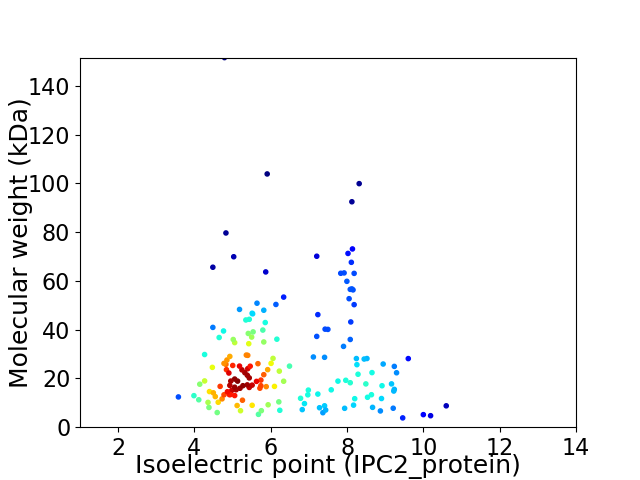
Virtual 2D-PAGE plot for 166 proteins (isoelectric point calculated using IPC2_protein)
Get csv file with sequences according to given criteria:
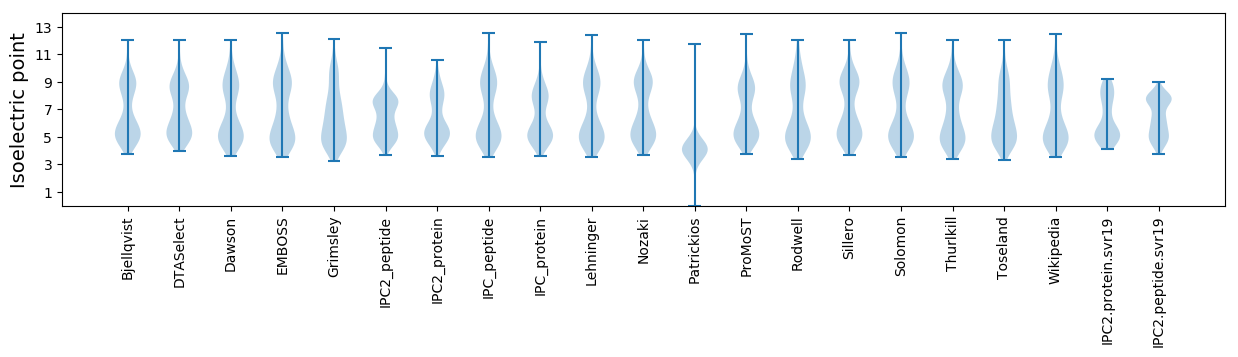
* You can choose from 21 different methods for calculating isoelectric point
Summary statistics related to proteome-wise predictions
Protein with the lowest isoelectric point:
>tr|F4YAI3|F4YAI3_9CAUD Ribonucleoside-diphosphate reductase OS=Campylobacter virus NCTC12673 OX=934027 PE=3 SV=1
MM1 pKa = 7.24IQFNLLCSYY10 pKa = 10.7VIFSSITCVIFNDD23 pKa = 3.18IDD25 pKa = 3.43NRR27 pKa = 11.84EE28 pKa = 4.12YY29 pKa = 11.15EE30 pKa = 4.04NMIVEE35 pKa = 5.41FISIFIFFIFFVYY48 pKa = 10.31QLIIYY53 pKa = 10.3RR54 pKa = 11.84NFNRR58 pKa = 11.84DD59 pKa = 3.09KK60 pKa = 11.72VEE62 pKa = 5.33DD63 pKa = 3.92NLCC66 pKa = 3.85
MM1 pKa = 7.24IQFNLLCSYY10 pKa = 10.7VIFSSITCVIFNDD23 pKa = 3.18IDD25 pKa = 3.43NRR27 pKa = 11.84EE28 pKa = 4.12YY29 pKa = 11.15EE30 pKa = 4.04NMIVEE35 pKa = 5.41FISIFIFFIFFVYY48 pKa = 10.31QLIIYY53 pKa = 10.3RR54 pKa = 11.84NFNRR58 pKa = 11.84DD59 pKa = 3.09KK60 pKa = 11.72VEE62 pKa = 5.33DD63 pKa = 3.92NLCC66 pKa = 3.85
Molecular weight: 8.1 kDa
Isoelectric point according different methods:
Protein with the highest isoelectric point:
>tr|F4YA75|F4YA75_9CAUD Gp62 clamp loader subunit OS=Campylobacter virus NCTC12673 OX=934027 PE=4 SV=1
MM1 pKa = 7.31KK2 pKa = 9.96RR3 pKa = 11.84DD4 pKa = 3.31GSIIKK9 pKa = 10.08SFKK12 pKa = 10.65RR13 pKa = 11.84EE14 pKa = 3.62INLQTRR20 pKa = 11.84FIKK23 pKa = 10.85NKK25 pKa = 8.46TKK27 pKa = 8.49YY28 pKa = 7.92TRR30 pKa = 11.84KK31 pKa = 9.49EE32 pKa = 3.71KK33 pKa = 10.38HH34 pKa = 6.19KK35 pKa = 10.51KK36 pKa = 8.96GAINGFNN43 pKa = 3.3
MM1 pKa = 7.31KK2 pKa = 9.96RR3 pKa = 11.84DD4 pKa = 3.31GSIIKK9 pKa = 10.08SFKK12 pKa = 10.65RR13 pKa = 11.84EE14 pKa = 3.62INLQTRR20 pKa = 11.84FIKK23 pKa = 10.85NKK25 pKa = 8.46TKK27 pKa = 8.49YY28 pKa = 7.92TRR30 pKa = 11.84KK31 pKa = 9.49EE32 pKa = 3.71KK33 pKa = 10.38HH34 pKa = 6.19KK35 pKa = 10.51KK36 pKa = 8.96GAINGFNN43 pKa = 3.3
Molecular weight: 5.15 kDa
Isoelectric point according different methods:
Peptides (in silico digests for buttom-up proteomics)
Below you can find in silico digests of the whole proteome with Trypsin, Chymotrypsin, Trypsin+LysC, LysN, ArgC proteases suitable for different mass spec machines.| Try ESI |
 |
|---|
| ChTry ESI |
|
|---|
| ArgC ESI |
|
|---|
| LysN ESI |
|
|---|
| TryLysC ESI |
|
|---|
| Try MALDI |
|
|---|
| ChTry MALDI |
|
|---|
| ArgC MALDI |
|
|---|
| LysN MALDI |
|
|---|
| TryLysC MALDI |
|
|---|
| Try LTQ |
|
|---|
| ChTry LTQ |
|
|---|
| ArgC LTQ |
|
|---|
| LysN LTQ |
|
|---|
| TryLysC LTQ |
|
|---|
| Try MSlow |
|
|---|
| ChTry MSlow |
|
|---|
| ArgC MSlow |
|
|---|
| LysN MSlow |
|
|---|
| TryLysC MSlow |
|
|---|
| Try MShigh |
|
|---|
| ChTry MShigh |
|
|---|
| ArgC MShigh |
|
|---|
| LysN MShigh |
|
|---|
| TryLysC MShigh |
|
|---|
General Statistics
Number of major isoforms |
Number of additional isoforms |
Number of all proteins |
Number of amino acids |
Min. Seq. Length |
Max. Seq. Length |
Avg. Seq. Length |
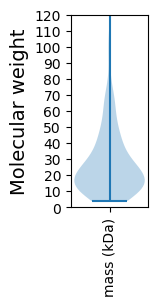
Avg. Mol. Weight |
|---|---|---|---|---|---|---|---|
0 |
40602 |
35 |
1365 |
244.6 |
28.23 |
Amino acid frequency
Ala |
Cys |
Asp |
Glu |
Phe |
Gly |
His |
Ile |
Lys |
Leu |
|---|---|---|---|---|---|---|---|---|---|
3.256 ± 0.174 | 1.877 ± 0.15 |
6.28 ± 0.191 | 6.81 ± 0.192 |
5.027 ± 0.147 | 4.983 ± 0.15 |
1.566 ± 0.092 | 9.359 ± 0.175 |
10.187 ± 0.221 | 8.741 ± 0.144 |
Met |
Asn |
Gln |
Pro |
Arg |
Ser |
Thr |
Val |
Trp |
Tyr |
|---|---|---|---|---|---|---|---|---|---|
2.118 ± 0.08 | 8.63 ± 0.175 |
2.579 ± 0.091 | 2.628 ± 0.09 |
2.68 ± 0.094 | 6.879 ± 0.161 |
5.167 ± 0.196 | 5.12 ± 0.142 |
0.825 ± 0.048 | 5.288 ± 0.128 |
Most of the basic statistics you can see at this page can be downloaded from this CSV file
See this proteome in:

Proteome-pI is available under Creative Commons Attribution-NoDerivs license, for more details see here
| Reference: Kozlowski LP. Proteome-pI 2.0: Proteome Isoelectric Point Database Update. Nucleic Acids Res. 2021, doi: 10.1093/nar/gkab944 | Contact: Lukasz P. Kozlowski |