Rhodanobacter sp. FW510-R10
Taxonomy: cellular organisms; Bacteria; Proteobacteria; Gammaproteobacteria; Xanthomonadales; Rhodanobacteraceae; Rhodanobacter; unclassified Rhodanobacter
Average proteome isoelectric point is 6.89
Get precalculated fractions of proteins
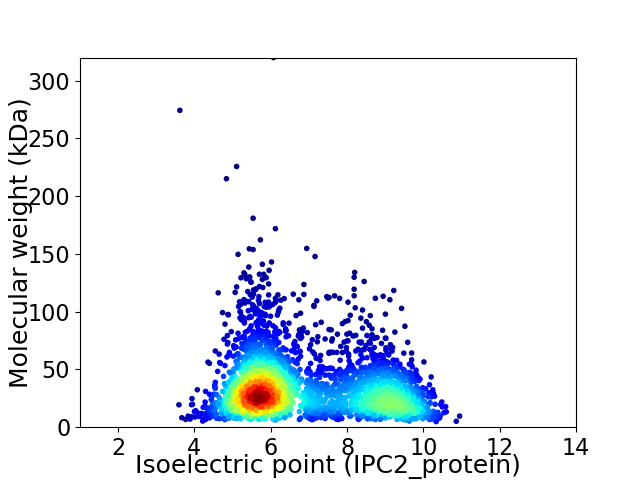
Virtual 2D-PAGE plot for 3386 proteins (isoelectric point calculated using IPC2_protein)
Get csv file with sequences according to given criteria:
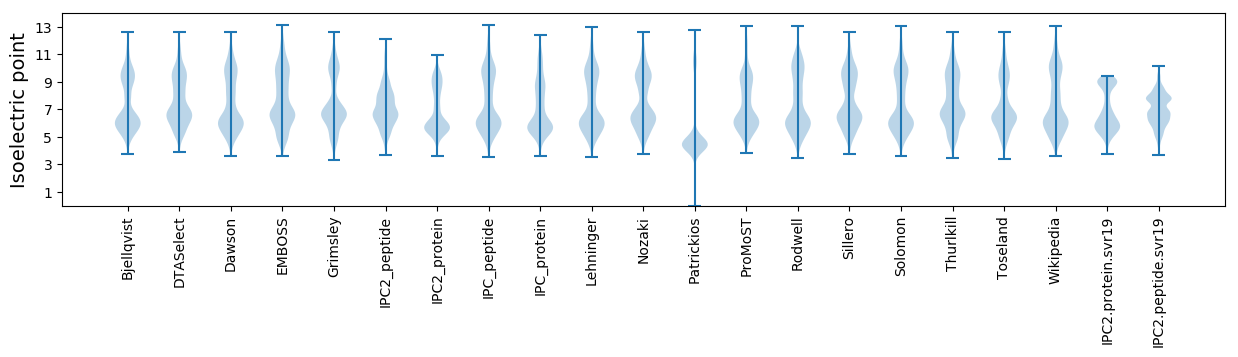
* You can choose from 21 different methods for calculating isoelectric point
Summary statistics related to proteome-wise predictions
Protein with the lowest isoelectric point:
>tr|A0A154R534|A0A154R534_9GAMM Tol-Pal system protein TolR OS=Rhodanobacter sp. FW510-R10 OX=1524462 GN=tolR PE=3 SV=1
MM1 pKa = 7.04SQSSTEE7 pKa = 3.75AAALRR12 pKa = 11.84KK13 pKa = 8.44WMCVVCGYY21 pKa = 10.35IYY23 pKa = 10.72DD24 pKa = 4.06EE25 pKa = 4.46AAGVPDD31 pKa = 3.78EE32 pKa = 5.36GIPAGTRR39 pKa = 11.84WADD42 pKa = 3.79VPDD45 pKa = 3.6TWTCPDD51 pKa = 3.9CGATKK56 pKa = 10.7ADD58 pKa = 3.71FEE60 pKa = 4.72MIEE63 pKa = 3.88IDD65 pKa = 3.43
MM1 pKa = 7.04SQSSTEE7 pKa = 3.75AAALRR12 pKa = 11.84KK13 pKa = 8.44WMCVVCGYY21 pKa = 10.35IYY23 pKa = 10.72DD24 pKa = 4.06EE25 pKa = 4.46AAGVPDD31 pKa = 3.78EE32 pKa = 5.36GIPAGTRR39 pKa = 11.84WADD42 pKa = 3.79VPDD45 pKa = 3.6TWTCPDD51 pKa = 3.9CGATKK56 pKa = 10.7ADD58 pKa = 3.71FEE60 pKa = 4.72MIEE63 pKa = 3.88IDD65 pKa = 3.43
Molecular weight: 7.05 kDa
Isoelectric point according different methods:
Protein with the highest isoelectric point:
>tr|A0A154R1P6|A0A154R1P6_9GAMM DNA repair photolyase OS=Rhodanobacter sp. FW510-R10 OX=1524462 GN=RhoFW510R10_15330 PE=4 SV=1
MM1 pKa = 7.45KK2 pKa = 9.59RR3 pKa = 11.84TFQPSKK9 pKa = 10.06LKK11 pKa = 10.38RR12 pKa = 11.84ARR14 pKa = 11.84THH16 pKa = 5.89GFRR19 pKa = 11.84ARR21 pKa = 11.84MATADD26 pKa = 3.35GRR28 pKa = 11.84KK29 pKa = 9.36VLNARR34 pKa = 11.84RR35 pKa = 11.84AKK37 pKa = 9.75GRR39 pKa = 11.84KK40 pKa = 8.92RR41 pKa = 11.84LIPP44 pKa = 4.02
MM1 pKa = 7.45KK2 pKa = 9.59RR3 pKa = 11.84TFQPSKK9 pKa = 10.06LKK11 pKa = 10.38RR12 pKa = 11.84ARR14 pKa = 11.84THH16 pKa = 5.89GFRR19 pKa = 11.84ARR21 pKa = 11.84MATADD26 pKa = 3.35GRR28 pKa = 11.84KK29 pKa = 9.36VLNARR34 pKa = 11.84RR35 pKa = 11.84AKK37 pKa = 9.75GRR39 pKa = 11.84KK40 pKa = 8.92RR41 pKa = 11.84LIPP44 pKa = 4.02
Molecular weight: 5.13 kDa
Isoelectric point according different methods:
Peptides (in silico digests for buttom-up proteomics)
Below you can find in silico digests of the whole proteome with Trypsin, Chymotrypsin, Trypsin+LysC, LysN, ArgC proteases suitable for different mass spec machines.| Try ESI |
 |
|---|
| ChTry ESI |
|
|---|
| ArgC ESI |
|
|---|
| LysN ESI |
|
|---|
| TryLysC ESI |
|
|---|
| Try MALDI |
|
|---|
| ChTry MALDI |
|
|---|
| ArgC MALDI |
|
|---|
| LysN MALDI |
|
|---|
| TryLysC MALDI |
|
|---|
| Try LTQ |
|
|---|
| ChTry LTQ |
|
|---|
| ArgC LTQ |
|
|---|
| LysN LTQ |
|
|---|
| TryLysC LTQ |
|
|---|
| Try MSlow |
|
|---|
| ChTry MSlow |
|
|---|
| ArgC MSlow |
|
|---|
| LysN MSlow |
|
|---|
| TryLysC MSlow |
|
|---|
| Try MShigh |
|
|---|
| ChTry MShigh |
|
|---|
| ArgC MShigh |
|
|---|
| LysN MShigh |
|
|---|
| TryLysC MShigh |
|
|---|
General Statistics
Number of major isoforms |
Number of additional isoforms |
Number of all proteins |
Number of amino acids |
Min. Seq. Length |
Max. Seq. Length |
Avg. Seq. Length |
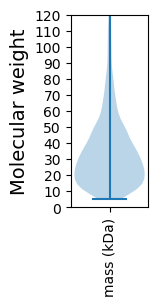
Avg. Mol. Weight |
|---|---|---|---|---|---|---|---|
0 |
1116988 |
41 |
2878 |
329.9 |
35.84 |
Amino acid frequency
Ala |
Cys |
Asp |
Glu |
Phe |
Gly |
His |
Ile |
Lys |
Leu |
|---|---|---|---|---|---|---|---|---|---|
13.141 ± 0.062 | 0.865 ± 0.014 |
5.678 ± 0.033 | 5.053 ± 0.038 |
3.348 ± 0.026 | 8.586 ± 0.044 |
2.507 ± 0.019 | 4.136 ± 0.027 |
2.885 ± 0.031 | 11.13 ± 0.057 |
Met |
Asn |
Gln |
Pro |
Arg |
Ser |
Thr |
Val |
Trp |
Tyr |
|---|---|---|---|---|---|---|---|---|---|
2.201 ± 0.02 | 2.523 ± 0.035 |
5.357 ± 0.03 | 3.838 ± 0.025 |
7.503 ± 0.052 | 5.054 ± 0.037 |
4.812 ± 0.038 | 7.382 ± 0.036 |
1.543 ± 0.019 | 2.458 ± 0.026 |
Most of the basic statistics you can see at this page can be downloaded from this CSV file
See this proteome in:

Proteome-pI is available under Creative Commons Attribution-NoDerivs license, for more details see here
| Reference: Kozlowski LP. Proteome-pI 2.0: Proteome Isoelectric Point Database Update. Nucleic Acids Res. 2021, doi: 10.1093/nar/gkab944 | Contact: Lukasz P. Kozlowski |