Sclerotinia sclerotiorum (strain ATCC 18683 / 1980 / Ss-1) (White mold) (Whetzelinia sclerotiorum)
Taxonomy: cellular organisms; Eukaryota; Opisthokonta; Fungi; Dikarya; Ascomycota; saccharomyceta; Pezizomycotina; leotiomyceta; sordariomyceta; Leotiomycetes; Helotiales; Sclerotiniaceae; Sclerotinia; Sclerotinia sclerotiorum
Average proteome isoelectric point is 6.68
Get precalculated fractions of proteins
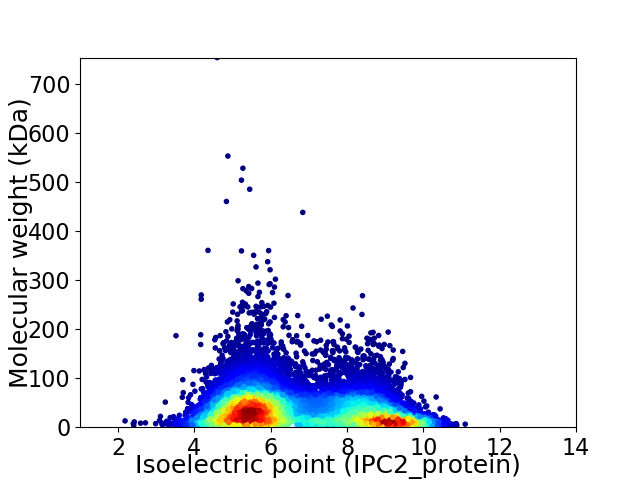
Virtual 2D-PAGE plot for 14445 proteins (isoelectric point calculated using IPC2_protein)
Get csv file with sequences according to given criteria:
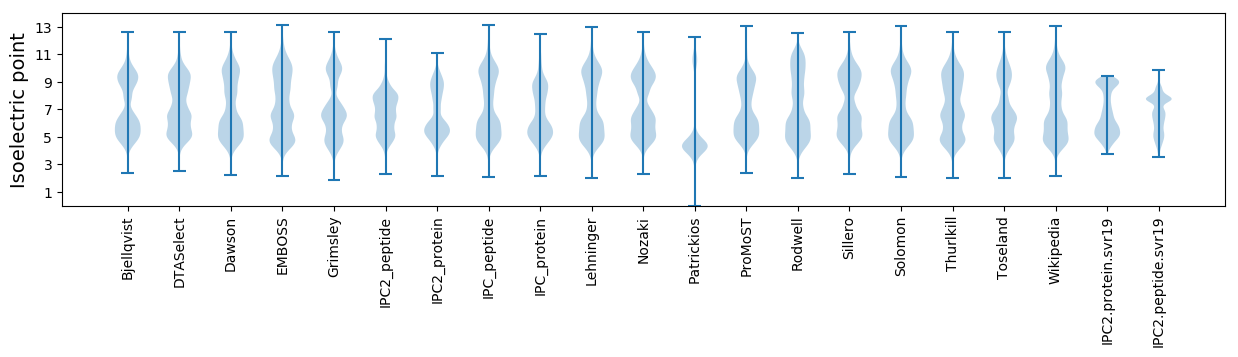
* You can choose from 21 different methods for calculating isoelectric point
Summary statistics related to proteome-wise predictions
Protein with the lowest isoelectric point:
>tr|A7EBU4|A7EBU4_SCLS1 Uncharacterized protein OS=Sclerotinia sclerotiorum (strain ATCC 18683 / 1980 / Ss-1) OX=665079 GN=SS1G_02780 PE=4 SV=1
MM1 pKa = 7.59AHH3 pKa = 7.23LEE5 pKa = 4.25PNAEE9 pKa = 3.78AQAPIRR15 pKa = 11.84RR16 pKa = 11.84RR17 pKa = 11.84MFGCEE22 pKa = 3.57FTYY25 pKa = 11.2DD26 pKa = 4.01NINHH30 pKa = 6.2FQYY33 pKa = 10.53KK34 pKa = 10.12GYY36 pKa = 10.77SFDD39 pKa = 4.02PLQEE43 pKa = 3.94PEE45 pKa = 4.32VFHH48 pKa = 6.89EE49 pKa = 4.49KK50 pKa = 11.04NNDD53 pKa = 2.7INYY56 pKa = 8.28WKK58 pKa = 10.43AQLAFRR64 pKa = 11.84GASSAGNDD72 pKa = 3.28MDD74 pKa = 4.94QIWGGDD80 pKa = 3.06EE81 pKa = 3.94WEE83 pKa = 4.39EE84 pKa = 4.49DD85 pKa = 4.18GEE87 pKa = 4.5DD88 pKa = 3.7EE89 pKa = 5.73EE90 pKa = 5.77AGEE93 pKa = 5.01WEE95 pKa = 4.56DD96 pKa = 3.51DD97 pKa = 3.38WEE99 pKa = 4.61EE100 pKa = 3.9EE101 pKa = 4.15VEE103 pKa = 4.45EE104 pKa = 4.38YY105 pKa = 10.86EE106 pKa = 5.5LYY108 pKa = 11.07DD109 pKa = 3.39EE110 pKa = 4.64VMEE113 pKa = 5.46DD114 pKa = 3.94EE115 pKa = 5.23EE116 pKa = 5.71DD117 pKa = 4.23DD118 pKa = 4.61EE119 pKa = 4.88YY120 pKa = 11.2EE121 pKa = 3.76QYY123 pKa = 11.36YY124 pKa = 10.41EE125 pKa = 4.06IGEE128 pKa = 4.24HH129 pKa = 6.64RR130 pKa = 11.84DD131 pKa = 3.16EE132 pKa = 6.84DD133 pKa = 4.15EE134 pKa = 5.46DD135 pKa = 5.21DD136 pKa = 3.9NGHH139 pKa = 7.04AGGNFEE145 pKa = 5.82GIVNLIGGGGGNLDD159 pKa = 3.18YY160 pKa = 10.58TYY162 pKa = 10.94RR163 pKa = 11.84SWRR166 pKa = 11.84LL167 pKa = 3.04
MM1 pKa = 7.59AHH3 pKa = 7.23LEE5 pKa = 4.25PNAEE9 pKa = 3.78AQAPIRR15 pKa = 11.84RR16 pKa = 11.84RR17 pKa = 11.84MFGCEE22 pKa = 3.57FTYY25 pKa = 11.2DD26 pKa = 4.01NINHH30 pKa = 6.2FQYY33 pKa = 10.53KK34 pKa = 10.12GYY36 pKa = 10.77SFDD39 pKa = 4.02PLQEE43 pKa = 3.94PEE45 pKa = 4.32VFHH48 pKa = 6.89EE49 pKa = 4.49KK50 pKa = 11.04NNDD53 pKa = 2.7INYY56 pKa = 8.28WKK58 pKa = 10.43AQLAFRR64 pKa = 11.84GASSAGNDD72 pKa = 3.28MDD74 pKa = 4.94QIWGGDD80 pKa = 3.06EE81 pKa = 3.94WEE83 pKa = 4.39EE84 pKa = 4.49DD85 pKa = 4.18GEE87 pKa = 4.5DD88 pKa = 3.7EE89 pKa = 5.73EE90 pKa = 5.77AGEE93 pKa = 5.01WEE95 pKa = 4.56DD96 pKa = 3.51DD97 pKa = 3.38WEE99 pKa = 4.61EE100 pKa = 3.9EE101 pKa = 4.15VEE103 pKa = 4.45EE104 pKa = 4.38YY105 pKa = 10.86EE106 pKa = 5.5LYY108 pKa = 11.07DD109 pKa = 3.39EE110 pKa = 4.64VMEE113 pKa = 5.46DD114 pKa = 3.94EE115 pKa = 5.23EE116 pKa = 5.71DD117 pKa = 4.23DD118 pKa = 4.61EE119 pKa = 4.88YY120 pKa = 11.2EE121 pKa = 3.76QYY123 pKa = 11.36YY124 pKa = 10.41EE125 pKa = 4.06IGEE128 pKa = 4.24HH129 pKa = 6.64RR130 pKa = 11.84DD131 pKa = 3.16EE132 pKa = 6.84DD133 pKa = 4.15EE134 pKa = 5.46DD135 pKa = 5.21DD136 pKa = 3.9NGHH139 pKa = 7.04AGGNFEE145 pKa = 5.82GIVNLIGGGGGNLDD159 pKa = 3.18YY160 pKa = 10.58TYY162 pKa = 10.94RR163 pKa = 11.84SWRR166 pKa = 11.84LL167 pKa = 3.04
Molecular weight: 19.62 kDa
Isoelectric point according different methods:
Protein with the highest isoelectric point:
>tr|A7E5V2|A7E5V2_SCLS1 Chitinase OS=Sclerotinia sclerotiorum (strain ATCC 18683 / 1980 / Ss-1) OX=665079 GN=SS1G_00677 PE=3 SV=1
MM1 pKa = 7.94PSQKK5 pKa = 10.41SFRR8 pKa = 11.84TKK10 pKa = 10.33QKK12 pKa = 10.05LARR15 pKa = 11.84AQKK18 pKa = 8.97QNRR21 pKa = 11.84PIPQWIRR28 pKa = 11.84LRR30 pKa = 11.84TGNTIRR36 pKa = 11.84YY37 pKa = 5.79NAKK40 pKa = 8.89RR41 pKa = 11.84RR42 pKa = 11.84HH43 pKa = 4.15WRR45 pKa = 11.84KK46 pKa = 7.46TRR48 pKa = 11.84IGLL51 pKa = 3.73
MM1 pKa = 7.94PSQKK5 pKa = 10.41SFRR8 pKa = 11.84TKK10 pKa = 10.33QKK12 pKa = 10.05LARR15 pKa = 11.84AQKK18 pKa = 8.97QNRR21 pKa = 11.84PIPQWIRR28 pKa = 11.84LRR30 pKa = 11.84TGNTIRR36 pKa = 11.84YY37 pKa = 5.79NAKK40 pKa = 8.89RR41 pKa = 11.84RR42 pKa = 11.84HH43 pKa = 4.15WRR45 pKa = 11.84KK46 pKa = 7.46TRR48 pKa = 11.84IGLL51 pKa = 3.73
Molecular weight: 6.27 kDa
Isoelectric point according different methods:
Peptides (in silico digests for buttom-up proteomics)
Below you can find in silico digests of the whole proteome with Trypsin, Chymotrypsin, Trypsin+LysC, LysN, ArgC proteases suitable for different mass spec machines.| Try ESI |
 |
|---|
| ChTry ESI |
|
|---|
| ArgC ESI |
|
|---|
| LysN ESI |
|
|---|
| TryLysC ESI |
|
|---|
| Try MALDI |
|
|---|
| ChTry MALDI |
|
|---|
| ArgC MALDI |
|
|---|
| LysN MALDI |
|
|---|
| TryLysC MALDI |
|
|---|
| Try LTQ |
|
|---|
| ChTry LTQ |
|
|---|
| ArgC LTQ |
|
|---|
| LysN LTQ |
|
|---|
| TryLysC LTQ |
|
|---|
| Try MSlow |
|
|---|
| ChTry MSlow |
|
|---|
| ArgC MSlow |
|
|---|
| LysN MSlow |
|
|---|
| TryLysC MSlow |
|
|---|
| Try MShigh |
|
|---|
| ChTry MShigh |
|
|---|
| ArgC MShigh |
|
|---|
| LysN MShigh |
|
|---|
| TryLysC MShigh |
|
|---|
General Statistics
Number of major isoforms |
Number of additional isoforms |
Number of all proteins |
Number of amino acids |
Min. Seq. Length |
Max. Seq. Length |
Avg. Seq. Length |
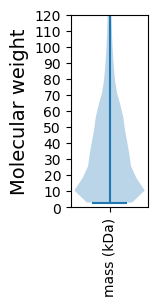
Avg. Mol. Weight |
|---|---|---|---|---|---|---|---|
0 |
5243077 |
28 |
6771 |
363.0 |
40.33 |
Amino acid frequency
Ala |
Cys |
Asp |
Glu |
Phe |
Gly |
His |
Ile |
Lys |
Leu |
|---|---|---|---|---|---|---|---|---|---|
7.627 ± 0.018 | 1.205 ± 0.009 |
5.524 ± 0.017 | 6.656 ± 0.03 |
3.713 ± 0.014 | 6.817 ± 0.023 |
2.268 ± 0.01 | 5.575 ± 0.016 |
5.665 ± 0.025 | 8.489 ± 0.023 |
Met |
Asn |
Gln |
Pro |
Arg |
Ser |
Thr |
Val |
Trp |
Tyr |
|---|---|---|---|---|---|---|---|---|---|
2.285 ± 0.01 | 4.268 ± 0.014 |
5.649 ± 0.021 | 3.854 ± 0.019 |
5.752 ± 0.02 | 8.629 ± 0.031 |
6.086 ± 0.019 | 5.736 ± 0.017 |
1.381 ± 0.009 | 2.819 ± 0.013 |
Most of the basic statistics you can see at this page can be downloaded from this CSV file
See this proteome in:

Proteome-pI is available under Creative Commons Attribution-NoDerivs license, for more details see here
| Reference: Kozlowski LP. Proteome-pI 2.0: Proteome Isoelectric Point Database Update. Nucleic Acids Res. 2021, doi: 10.1093/nar/gkab944 | Contact: Lukasz P. Kozlowski |