Burkholderia phage AP3
Taxonomy: Viruses; Duplodnaviria; Heunggongvirae; Uroviricota; Caudoviricetes; Caudovirales; Myoviridae; Peduovirinae; Kisquinquevirus; Burkholderia virus AP3
Average proteome isoelectric point is 7.04
Get precalculated fractions of proteins
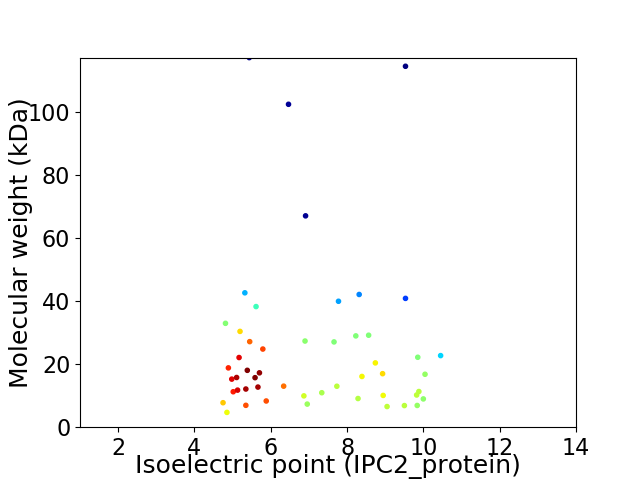
Virtual 2D-PAGE plot for 51 proteins (isoelectric point calculated using IPC2_protein)
Get csv file with sequences according to given criteria:
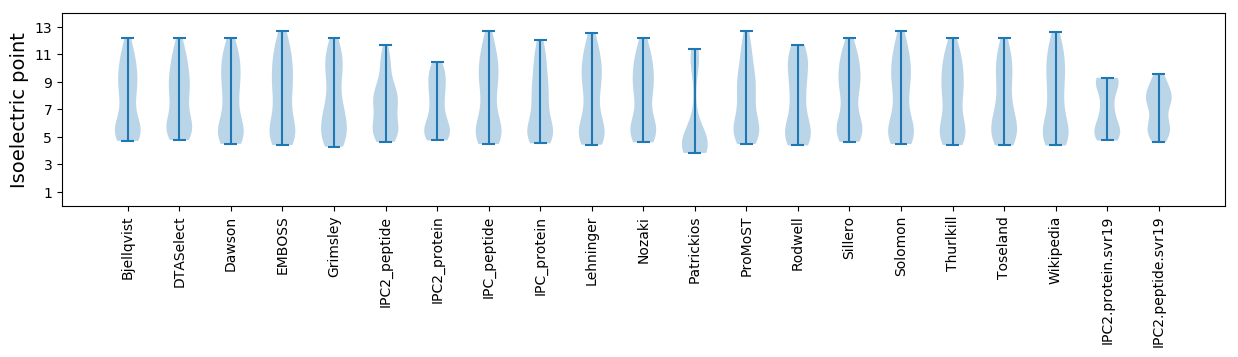
* You can choose from 21 different methods for calculating isoelectric point
Summary statistics related to proteome-wise predictions
Protein with the lowest isoelectric point:
>tr|A0A1S5NR72|A0A1S5NR72_9CAUD Putative baseplate assembly protein OS=Burkholderia phage AP3 OX=1636201 GN=vB_BceM_AP3_0023 PE=4 SV=1
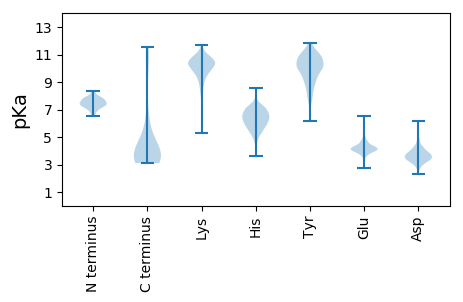
MM1 pKa = 7.81MIRR4 pKa = 11.84ALQGEE9 pKa = 4.8TVDD12 pKa = 3.74ALCWRR17 pKa = 11.84VLGRR21 pKa = 11.84TRR23 pKa = 11.84GVVEE27 pKa = 5.05AVLDD31 pKa = 4.17LNRR34 pKa = 11.84DD35 pKa = 3.4LAQYY39 pKa = 10.96GPILPHH45 pKa = 6.42GLLVEE50 pKa = 4.89LPDD53 pKa = 4.34EE54 pKa = 4.68VPQAAQSGAEE64 pKa = 4.6RR65 pKa = 11.84LQLWDD70 pKa = 3.27
MM1 pKa = 7.81MIRR4 pKa = 11.84ALQGEE9 pKa = 4.8TVDD12 pKa = 3.74ALCWRR17 pKa = 11.84VLGRR21 pKa = 11.84TRR23 pKa = 11.84GVVEE27 pKa = 5.05AVLDD31 pKa = 4.17LNRR34 pKa = 11.84DD35 pKa = 3.4LAQYY39 pKa = 10.96GPILPHH45 pKa = 6.42GLLVEE50 pKa = 4.89LPDD53 pKa = 4.34EE54 pKa = 4.68VPQAAQSGAEE64 pKa = 4.6RR65 pKa = 11.84LQLWDD70 pKa = 3.27
Molecular weight: 7.76 kDa
Isoelectric point according different methods:
Protein with the highest isoelectric point:
>tr|A0A1U7AE31|A0A1U7AE31_9CAUD O-spanin OS=Burkholderia phage AP3 OX=1636201 GN=vB_BceM_AP3_0017 PE=4 SV=1
MM1 pKa = 7.73WIAKK5 pKa = 9.68RR6 pKa = 11.84IAPALFLLALCACTTAPPPTCRR28 pKa = 11.84RR29 pKa = 11.84AIPEE33 pKa = 3.82ALMRR37 pKa = 11.84PPRR40 pKa = 11.84ALHH43 pKa = 6.07SLPSPQPSPATTPPVMKK60 pKa = 10.08TPSNN64 pKa = 3.62
MM1 pKa = 7.73WIAKK5 pKa = 9.68RR6 pKa = 11.84IAPALFLLALCACTTAPPPTCRR28 pKa = 11.84RR29 pKa = 11.84AIPEE33 pKa = 3.82ALMRR37 pKa = 11.84PPRR40 pKa = 11.84ALHH43 pKa = 6.07SLPSPQPSPATTPPVMKK60 pKa = 10.08TPSNN64 pKa = 3.62
Molecular weight: 6.86 kDa
Isoelectric point according different methods:
Peptides (in silico digests for buttom-up proteomics)
Below you can find in silico digests of the whole proteome with Trypsin, Chymotrypsin, Trypsin+LysC, LysN, ArgC proteases suitable for different mass spec machines.| Try ESI |
 |
|---|
| ChTry ESI |
|
|---|
| ArgC ESI |
|
|---|
| LysN ESI |
|
|---|
| TryLysC ESI |
|
|---|
| Try MALDI |
|
|---|
| ChTry MALDI |
|
|---|
| ArgC MALDI |
|
|---|
| LysN MALDI |
|
|---|
| TryLysC MALDI |
|
|---|
| Try LTQ |
|
|---|
| ChTry LTQ |
|
|---|
| ArgC LTQ |
|
|---|
| LysN LTQ |
|
|---|
| TryLysC LTQ |
|
|---|
| Try MSlow |
|
|---|
| ChTry MSlow |
|
|---|
| ArgC MSlow |
|
|---|
| LysN MSlow |
|
|---|
| TryLysC MSlow |
|
|---|
| Try MShigh |
|
|---|
| ChTry MShigh |
|
|---|
| ArgC MShigh |
|
|---|
| LysN MShigh |
|
|---|
| TryLysC MShigh |
|
|---|
General Statistics
Number of major isoforms |
Number of additional isoforms |
Number of all proteins |
Number of amino acids |
Min. Seq. Length |
Max. Seq. Length |
Avg. Seq. Length |
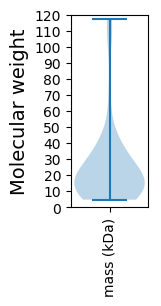
Avg. Mol. Weight |
|---|---|---|---|---|---|---|---|
0 |
11554 |
39 |
1113 |
226.5 |
24.9 |
Amino acid frequency
Ala |
Cys |
Asp |
Glu |
Phe |
Gly |
His |
Ile |
Lys |
Leu |
|---|---|---|---|---|---|---|---|---|---|
12.255 ± 0.637 | 0.926 ± 0.129 |
6.405 ± 0.433 | 4.933 ± 0.322 |
3.306 ± 0.2 | 8.006 ± 0.624 |
1.999 ± 0.218 | 4.509 ± 0.196 |
4.232 ± 0.271 | 8.75 ± 0.348 |
Met |
Asn |
Gln |
Pro |
Arg |
Ser |
Thr |
Val |
Trp |
Tyr |
|---|---|---|---|---|---|---|---|---|---|
2.302 ± 0.158 | 3.185 ± 0.358 |
4.778 ± 0.358 | 3.748 ± 0.214 |
8.317 ± 0.463 | 5.08 ± 0.191 |
6.007 ± 0.307 | 7.019 ± 0.272 |
1.636 ± 0.148 | 2.605 ± 0.237 |
Most of the basic statistics you can see at this page can be downloaded from this CSV file
See this proteome in:

Proteome-pI is available under Creative Commons Attribution-NoDerivs license, for more details see here
| Reference: Kozlowski LP. Proteome-pI 2.0: Proteome Isoelectric Point Database Update. Nucleic Acids Res. 2021, doi: 10.1093/nar/gkab944 | Contact: Lukasz P. Kozlowski |