Sporosarcina newyorkensis 2681
Taxonomy: cellular organisms; Bacteria; Terrabacteria group; Firmicutes; Bacilli; Bacillales; Planococcaceae; Sporosarcina; Sporosarcina newyorkensis
Average proteome isoelectric point is 6.23
Get precalculated fractions of proteins
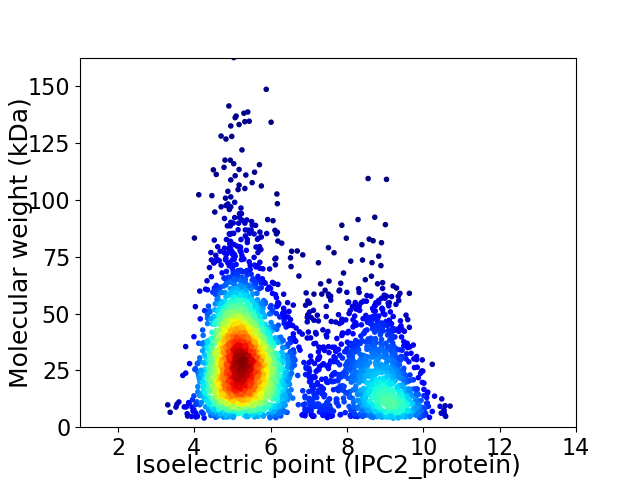
Virtual 2D-PAGE plot for 3825 proteins (isoelectric point calculated using IPC2_protein)
Get csv file with sequences according to given criteria:
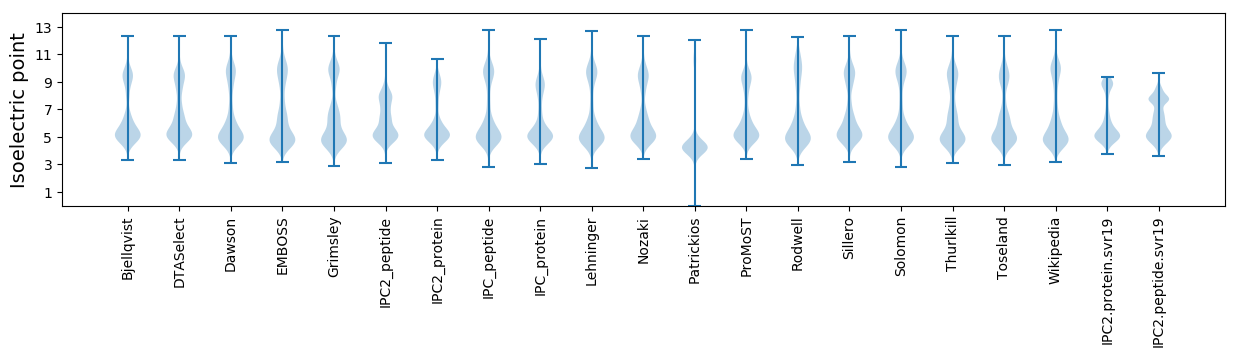
* You can choose from 21 different methods for calculating isoelectric point
Summary statistics related to proteome-wise predictions
Protein with the lowest isoelectric point:
>tr|F9DQ54|F9DQ54_9BACL Glucose-6-phosphate isomerase (Fragment) OS=Sporosarcina newyorkensis 2681 OX=1027292 GN=pgi3 PE=4 SV=1
VV1 pKa = 7.16LLDD4 pKa = 4.59DD5 pKa = 4.47QDD7 pKa = 4.13HH8 pKa = 7.2DD9 pKa = 4.43SVDD12 pKa = 3.4YY13 pKa = 11.67AMNQLRR19 pKa = 11.84QSFGEE24 pKa = 4.14LFPQVFKK31 pKa = 10.72TITSDD36 pKa = 3.21NGSEE40 pKa = 4.07FSNLTVGLEE49 pKa = 4.28GVTDD53 pKa = 3.85VYY55 pKa = 10.93FCRR58 pKa = 11.84PYY60 pKa = 11.23SPLL63 pKa = 3.52
VV1 pKa = 7.16LLDD4 pKa = 4.59DD5 pKa = 4.47QDD7 pKa = 4.13HH8 pKa = 7.2DD9 pKa = 4.43SVDD12 pKa = 3.4YY13 pKa = 11.67AMNQLRR19 pKa = 11.84QSFGEE24 pKa = 4.14LFPQVFKK31 pKa = 10.72TITSDD36 pKa = 3.21NGSEE40 pKa = 4.07FSNLTVGLEE49 pKa = 4.28GVTDD53 pKa = 3.85VYY55 pKa = 10.93FCRR58 pKa = 11.84PYY60 pKa = 11.23SPLL63 pKa = 3.52
Molecular weight: 7.12 kDa
Isoelectric point according different methods:
Protein with the highest isoelectric point:
>tr|F9DRN2|F9DRN2_9BACL Hemerythrin HHE cation binding domain protein OS=Sporosarcina newyorkensis 2681 OX=1027292 GN=HMPREF9372_1462 PE=4 SV=1
MM1 pKa = 7.3QKK3 pKa = 11.06DD4 pKa = 3.9EE5 pKa = 4.3MNGRR9 pKa = 11.84ALYY12 pKa = 10.27CSSFLFVNKK21 pKa = 10.25KK22 pKa = 10.15GGQNPFGNRR31 pKa = 11.84LMNKK35 pKa = 8.37GRR37 pKa = 11.84RR38 pKa = 11.84TMDD41 pKa = 3.38CSSYY45 pKa = 10.72IIFTSRR51 pKa = 11.84IAITAAIQLRR61 pKa = 11.84TRR63 pKa = 11.84IGSATAA69 pKa = 3.58
MM1 pKa = 7.3QKK3 pKa = 11.06DD4 pKa = 3.9EE5 pKa = 4.3MNGRR9 pKa = 11.84ALYY12 pKa = 10.27CSSFLFVNKK21 pKa = 10.25KK22 pKa = 10.15GGQNPFGNRR31 pKa = 11.84LMNKK35 pKa = 8.37GRR37 pKa = 11.84RR38 pKa = 11.84TMDD41 pKa = 3.38CSSYY45 pKa = 10.72IIFTSRR51 pKa = 11.84IAITAAIQLRR61 pKa = 11.84TRR63 pKa = 11.84IGSATAA69 pKa = 3.58
Molecular weight: 7.71 kDa
Isoelectric point according different methods:
Peptides (in silico digests for buttom-up proteomics)
Below you can find in silico digests of the whole proteome with Trypsin, Chymotrypsin, Trypsin+LysC, LysN, ArgC proteases suitable for different mass spec machines.| Try ESI |
 |
|---|
| ChTry ESI |
|
|---|
| ArgC ESI |
|
|---|
| LysN ESI |
|
|---|
| TryLysC ESI |
|
|---|
| Try MALDI |
|
|---|
| ChTry MALDI |
|
|---|
| ArgC MALDI |
|
|---|
| LysN MALDI |
|
|---|
| TryLysC MALDI |
|
|---|
| Try LTQ |
|
|---|
| ChTry LTQ |
|
|---|
| ArgC LTQ |
|
|---|
| LysN LTQ |
|
|---|
| TryLysC LTQ |
|
|---|
| Try MSlow |
|
|---|
| ChTry MSlow |
|
|---|
| ArgC MSlow |
|
|---|
| LysN MSlow |
|
|---|
| TryLysC MSlow |
|
|---|
| Try MShigh |
|
|---|
| ChTry MShigh |
|
|---|
| ArgC MShigh |
|
|---|
| LysN MShigh |
|
|---|
| TryLysC MShigh |
|
|---|
General Statistics
Number of major isoforms |
Number of additional isoforms |
Number of all proteins |
Number of amino acids |
Min. Seq. Length |
Max. Seq. Length |
Avg. Seq. Length |
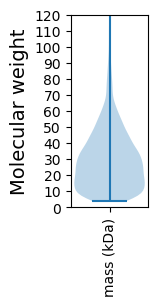
Avg. Mol. Weight |
|---|---|---|---|---|---|---|---|
0 |
1052618 |
39 |
1440 |
275.2 |
30.81 |
Amino acid frequency
Ala |
Cys |
Asp |
Glu |
Phe |
Gly |
His |
Ile |
Lys |
Leu |
|---|---|---|---|---|---|---|---|---|---|
7.539 ± 0.044 | 0.689 ± 0.012 |
5.181 ± 0.033 | 7.618 ± 0.048 |
4.489 ± 0.037 | 6.909 ± 0.044 |
2.047 ± 0.017 | 7.475 ± 0.038 |
6.358 ± 0.038 | 9.764 ± 0.047 |
Met |
Asn |
Gln |
Pro |
Arg |
Ser |
Thr |
Val |
Trp |
Tyr |
|---|---|---|---|---|---|---|---|---|---|
2.99 ± 0.02 | 3.952 ± 0.027 |
3.666 ± 0.024 | 3.907 ± 0.031 |
4.342 ± 0.033 | 5.978 ± 0.036 |
5.597 ± 0.023 | 7.213 ± 0.036 |
1.004 ± 0.014 | 3.282 ± 0.023 |
Most of the basic statistics you can see at this page can be downloaded from this CSV file
See this proteome in:

Proteome-pI is available under Creative Commons Attribution-NoDerivs license, for more details see here
| Reference: Kozlowski LP. Proteome-pI 2.0: Proteome Isoelectric Point Database Update. Nucleic Acids Res. 2021, doi: 10.1093/nar/gkab944 | Contact: Lukasz P. Kozlowski |