Erwinia phage Cronus
Taxonomy: Viruses; Duplodnaviria; Heunggongvirae; Uroviricota; Caudoviricetes; Caudovirales; Myoviridae; Tevenvirinae; unclassified Tevenvirinae
Average proteome isoelectric point is 6.11
Get precalculated fractions of proteins
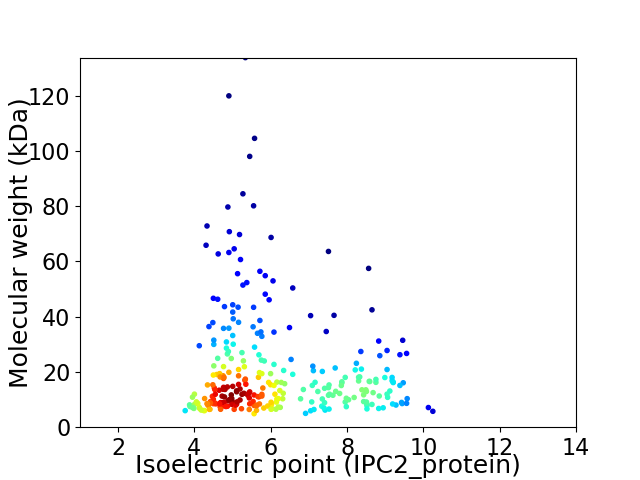
Virtual 2D-PAGE plot for 291 proteins (isoelectric point calculated using IPC2_protein)
Get csv file with sequences according to given criteria:
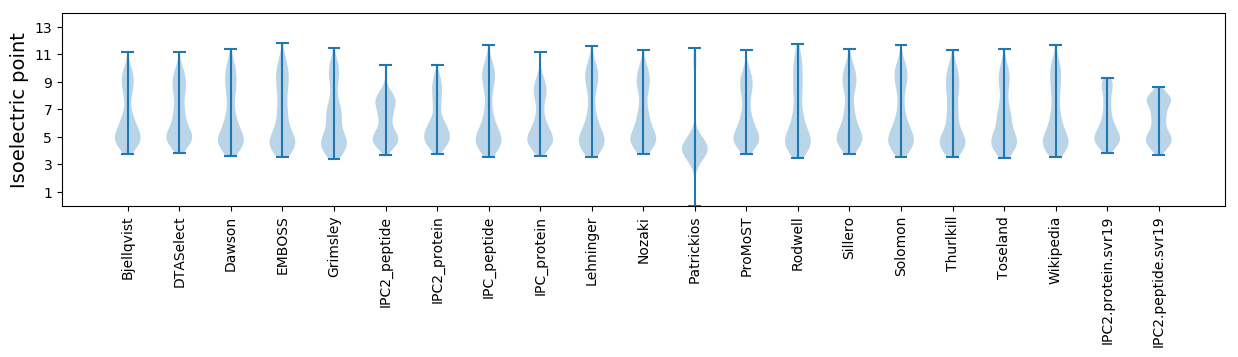
* You can choose from 21 different methods for calculating isoelectric point
Summary statistics related to proteome-wise predictions
Protein with the lowest isoelectric point:
>tr|A0A2S1GMD8|A0A2S1GMD8_9CAUD Macro domain protein OS=Erwinia phage Cronus OX=2163633 PE=4 SV=1
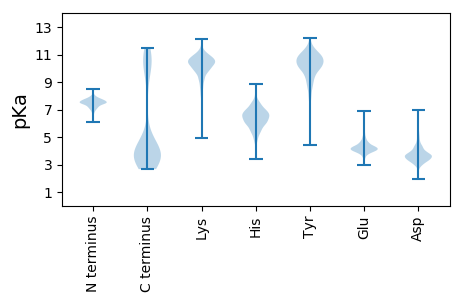
MM1 pKa = 7.66KK2 pKa = 10.45NQLLEE7 pKa = 4.39DD8 pKa = 4.0MNVEE12 pKa = 4.04PLLAPVIEE20 pKa = 4.33VCYY23 pKa = 9.95ATDD26 pKa = 3.5YY27 pKa = 11.41DD28 pKa = 5.38SYY30 pKa = 11.64DD31 pKa = 2.65VWAPVVQNGEE41 pKa = 3.9DD42 pKa = 3.48QYY44 pKa = 11.29IDD46 pKa = 3.19TGAGVLNLCDD56 pKa = 4.51AIIYY60 pKa = 7.69EE61 pKa = 4.15IRR63 pKa = 11.84IKK65 pKa = 10.66KK66 pKa = 9.43
MM1 pKa = 7.66KK2 pKa = 10.45NQLLEE7 pKa = 4.39DD8 pKa = 4.0MNVEE12 pKa = 4.04PLLAPVIEE20 pKa = 4.33VCYY23 pKa = 9.95ATDD26 pKa = 3.5YY27 pKa = 11.41DD28 pKa = 5.38SYY30 pKa = 11.64DD31 pKa = 2.65VWAPVVQNGEE41 pKa = 3.9DD42 pKa = 3.48QYY44 pKa = 11.29IDD46 pKa = 3.19TGAGVLNLCDD56 pKa = 4.51AIIYY60 pKa = 7.69EE61 pKa = 4.15IRR63 pKa = 11.84IKK65 pKa = 10.66KK66 pKa = 9.43
Molecular weight: 7.48 kDa
Isoelectric point according different methods:
Protein with the highest isoelectric point:
>tr|A0A2S1GMG4|A0A2S1GMG4_9CAUD Uncharacterized protein OS=Erwinia phage Cronus OX=2163633 PE=4 SV=1
MM1 pKa = 7.29LHH3 pKa = 6.23YY4 pKa = 10.56GIIFLIVALVAAALGFGALAGTAAMAAKK32 pKa = 10.12LVFVVGIIIFLVSLFTGRR50 pKa = 11.84RR51 pKa = 11.84ATTVVV56 pKa = 2.97
MM1 pKa = 7.29LHH3 pKa = 6.23YY4 pKa = 10.56GIIFLIVALVAAALGFGALAGTAAMAAKK32 pKa = 10.12LVFVVGIIIFLVSLFTGRR50 pKa = 11.84RR51 pKa = 11.84ATTVVV56 pKa = 2.97
Molecular weight: 5.75 kDa
Isoelectric point according different methods:
Peptides (in silico digests for buttom-up proteomics)
Below you can find in silico digests of the whole proteome with Trypsin, Chymotrypsin, Trypsin+LysC, LysN, ArgC proteases suitable for different mass spec machines.| Try ESI |
 |
|---|
| ChTry ESI |
|
|---|
| ArgC ESI |
|
|---|
| LysN ESI |
|
|---|
| TryLysC ESI |
|
|---|
| Try MALDI |
|
|---|
| ChTry MALDI |
|
|---|
| ArgC MALDI |
|
|---|
| LysN MALDI |
|
|---|
| TryLysC MALDI |
|
|---|
| Try LTQ |
|
|---|
| ChTry LTQ |
|
|---|
| ArgC LTQ |
|
|---|
| LysN LTQ |
|
|---|
| TryLysC LTQ |
|
|---|
| Try MSlow |
|
|---|
| ChTry MSlow |
|
|---|
| ArgC MSlow |
|
|---|
| LysN MSlow |
|
|---|
| TryLysC MSlow |
|
|---|
| Try MShigh |
|
|---|
| ChTry MShigh |
|
|---|
| ArgC MShigh |
|
|---|
| LysN MShigh |
|
|---|
| TryLysC MShigh |
|
|---|
General Statistics
Number of major isoforms |
Number of additional isoforms |
Number of all proteins |
Number of amino acids |
Min. Seq. Length |
Max. Seq. Length |
Avg. Seq. Length |
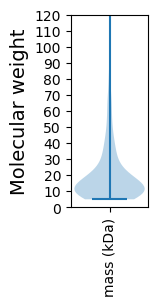
Avg. Mol. Weight |
|---|---|---|---|---|---|---|---|
0 |
53896 |
41 |
1242 |
185.2 |
20.95 |
Amino acid frequency
Ala |
Cys |
Asp |
Glu |
Phe |
Gly |
His |
Ile |
Lys |
Leu |
|---|---|---|---|---|---|---|---|---|---|
6.9 ± 0.204 | 0.996 ± 0.057 |
6.503 ± 0.113 | 6.809 ± 0.181 |
4.451 ± 0.099 | 6.032 ± 0.159 |
1.714 ± 0.084 | 6.904 ± 0.116 |
7.281 ± 0.172 | 7.746 ± 0.145 |
Met |
Asn |
Gln |
Pro |
Arg |
Ser |
Thr |
Val |
Trp |
Tyr |
|---|---|---|---|---|---|---|---|---|---|
2.672 ± 0.086 | 5.433 ± 0.119 |
3.366 ± 0.103 | 3.451 ± 0.09 |
4.312 ± 0.091 | 6.835 ± 0.143 |
6.095 ± 0.237 | 6.889 ± 0.128 |
1.464 ± 0.07 | 4.145 ± 0.113 |
Most of the basic statistics you can see at this page can be downloaded from this CSV file
See this proteome in:

Proteome-pI is available under Creative Commons Attribution-NoDerivs license, for more details see here
| Reference: Kozlowski LP. Proteome-pI 2.0: Proteome Isoelectric Point Database Update. Nucleic Acids Res. 2021, doi: 10.1093/nar/gkab944 | Contact: Lukasz P. Kozlowski |