Eubacterium sp. CAG:161
Taxonomy: cellular organisms; Bacteria; Terrabacteria group; Firmicutes; Clostridia; Eubacteriales; Eubacteriaceae; Eubacterium; environmental samples
Average proteome isoelectric point is 6.4
Get precalculated fractions of proteins
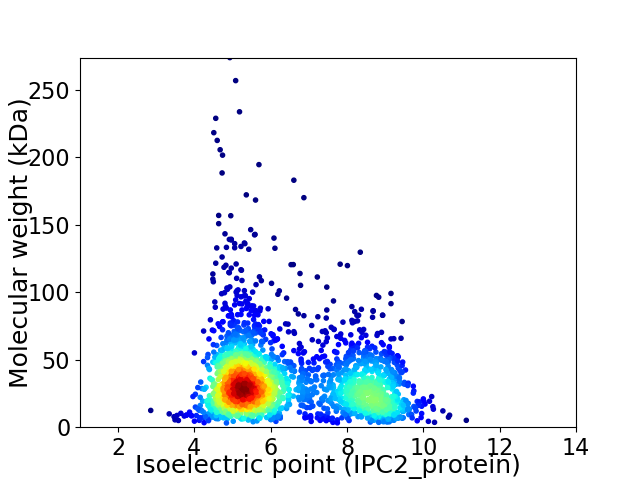
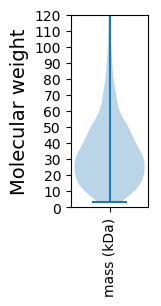
Virtual 2D-PAGE plot for 2196 proteins (isoelectric point calculated using IPC2_protein)
Get csv file with sequences according to given criteria:
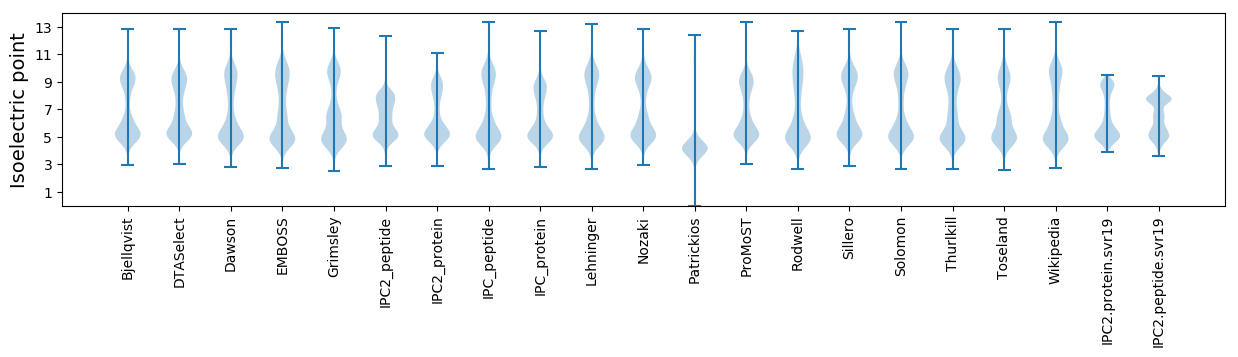
* You can choose from 21 different methods for calculating isoelectric point
Summary statistics related to proteome-wise predictions
Protein with the lowest isoelectric point:
>tr|R5KZW7|R5KZW7_9FIRM Deoxyguanosinetriphosphate triphosphohydrolase-like protein OS=Eubacterium sp. CAG:161 OX=1262881 GN=BN508_01145 PE=4 SV=1
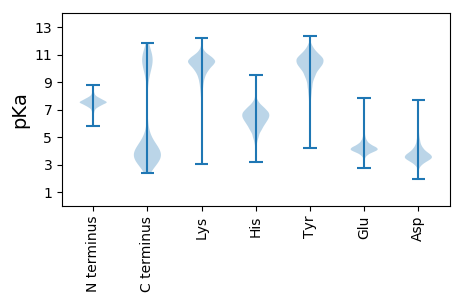
MM1 pKa = 7.26YY2 pKa = 10.86ALTDD6 pKa = 4.15YY7 pKa = 10.87IDD9 pKa = 4.58CEE11 pKa = 4.23ALADD15 pKa = 3.82TCEE18 pKa = 4.06EE19 pKa = 3.88NLAEE23 pKa = 5.17VEE25 pKa = 5.24DD26 pKa = 3.73IMNVKK31 pKa = 10.47KK32 pKa = 10.62NDD34 pKa = 3.76DD35 pKa = 3.76GLVVAEE41 pKa = 4.22NQAVV45 pKa = 3.09
MM1 pKa = 7.26YY2 pKa = 10.86ALTDD6 pKa = 4.15YY7 pKa = 10.87IDD9 pKa = 4.58CEE11 pKa = 4.23ALADD15 pKa = 3.82TCEE18 pKa = 4.06EE19 pKa = 3.88NLAEE23 pKa = 5.17VEE25 pKa = 5.24DD26 pKa = 3.73IMNVKK31 pKa = 10.47KK32 pKa = 10.62NDD34 pKa = 3.76DD35 pKa = 3.76GLVVAEE41 pKa = 4.22NQAVV45 pKa = 3.09
Molecular weight: 4.98 kDa
Isoelectric point according different methods:
Protein with the highest isoelectric point:
>tr|R5KW07|R5KW07_9FIRM Glft2_N domain-containing protein OS=Eubacterium sp. CAG:161 OX=1262881 GN=BN508_01945 PE=4 SV=1
MM1 pKa = 7.67KK2 pKa = 8.72MTFQPKK8 pKa = 8.95KK9 pKa = 7.58RR10 pKa = 11.84QRR12 pKa = 11.84SKK14 pKa = 9.07VHH16 pKa = 5.95GFRR19 pKa = 11.84KK20 pKa = 9.97RR21 pKa = 11.84MSTAGGRR28 pKa = 11.84KK29 pKa = 8.72VLASRR34 pKa = 11.84RR35 pKa = 11.84AKK37 pKa = 10.13GRR39 pKa = 11.84KK40 pKa = 8.85KK41 pKa = 10.63LSAA44 pKa = 3.95
MM1 pKa = 7.67KK2 pKa = 8.72MTFQPKK8 pKa = 8.95KK9 pKa = 7.58RR10 pKa = 11.84QRR12 pKa = 11.84SKK14 pKa = 9.07VHH16 pKa = 5.95GFRR19 pKa = 11.84KK20 pKa = 9.97RR21 pKa = 11.84MSTAGGRR28 pKa = 11.84KK29 pKa = 8.72VLASRR34 pKa = 11.84RR35 pKa = 11.84AKK37 pKa = 10.13GRR39 pKa = 11.84KK40 pKa = 8.85KK41 pKa = 10.63LSAA44 pKa = 3.95
Molecular weight: 5.09 kDa
Isoelectric point according different methods:
Peptides (in silico digests for buttom-up proteomics)
Below you can find in silico digests of the whole proteome with Trypsin, Chymotrypsin, Trypsin+LysC, LysN, ArgC proteases suitable for different mass spec machines.| Try ESI |
 |
|---|
| ChTry ESI |
|
|---|
| ArgC ESI |
|
|---|
| LysN ESI |
|
|---|
| TryLysC ESI |
|
|---|
| Try MALDI |
|
|---|
| ChTry MALDI |
|
|---|
| ArgC MALDI |
|
|---|
| LysN MALDI |
|
|---|
| TryLysC MALDI |
|
|---|
| Try LTQ |
|
|---|
| ChTry LTQ |
|
|---|
| ArgC LTQ |
|
|---|
| LysN LTQ |
|
|---|
| TryLysC LTQ |
|
|---|
| Try MSlow |
|
|---|
| ChTry MSlow |
|
|---|
| ArgC MSlow |
|
|---|
| LysN MSlow |
|
|---|
| TryLysC MSlow |
|
|---|
| Try MShigh |
|
|---|
| ChTry MShigh |
|
|---|
| ArgC MShigh |
|
|---|
| LysN MShigh |
|
|---|
| TryLysC MShigh |
|
|---|
General Statistics
Number of major isoforms |
Number of additional isoforms |
Number of all proteins |
Number of amino acids |
Min. Seq. Length |
Max. Seq. Length |
Avg. Seq. Length |
Avg. Mol. Weight |
|---|---|---|---|---|---|---|---|
0 |
721333 |
29 |
2449 |
328.5 |
36.97 |
Amino acid frequency
Ala |
Cys |
Asp |
Glu |
Phe |
Gly |
His |
Ile |
Lys |
Leu |
|---|---|---|---|---|---|---|---|---|---|
6.384 ± 0.05 | 1.358 ± 0.019 |
6.029 ± 0.045 | 7.061 ± 0.06 |
4.014 ± 0.039 | 6.843 ± 0.045 |
1.423 ± 0.021 | 8.415 ± 0.065 |
8.78 ± 0.064 | 7.73 ± 0.051 |
Met |
Asn |
Gln |
Pro |
Arg |
Ser |
Thr |
Val |
Trp |
Tyr |
|---|---|---|---|---|---|---|---|---|---|
3.0 ± 0.031 | 5.796 ± 0.047 |
2.794 ± 0.025 | 2.523 ± 0.024 |
3.496 ± 0.038 | 6.02 ± 0.044 |
5.618 ± 0.055 | 7.204 ± 0.046 |
0.844 ± 0.017 | 4.662 ± 0.047 |
Most of the basic statistics you can see at this page can be downloaded from this CSV file
See this proteome in:

Proteome-pI is available under Creative Commons Attribution-NoDerivs license, for more details see here
| Reference: Kozlowski LP. Proteome-pI 2.0: Proteome Isoelectric Point Database Update. Nucleic Acids Res. 2021, doi: 10.1093/nar/gkab944 | Contact: Lukasz P. Kozlowski |