Erwinia phage PEp14
Taxonomy: Viruses; Duplodnaviria; Heunggongvirae; Uroviricota; Caudoviricetes; Caudovirales; Podoviridae; unclassified Podoviridae
Average proteome isoelectric point is 6.51
Get precalculated fractions of proteins
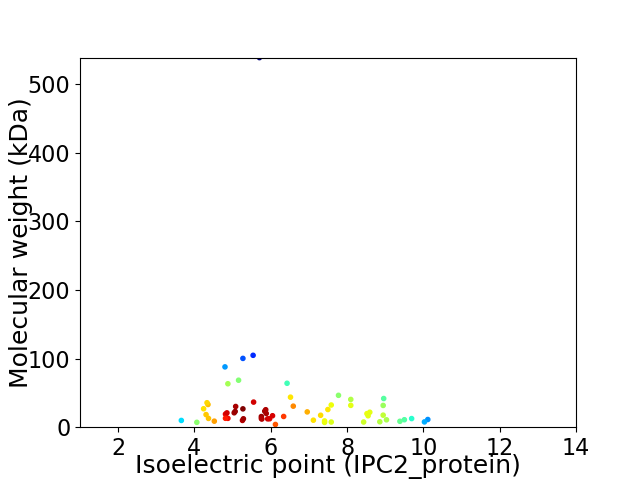
Virtual 2D-PAGE plot for 64 proteins (isoelectric point calculated using IPC2_protein)
Get csv file with sequences according to given criteria:
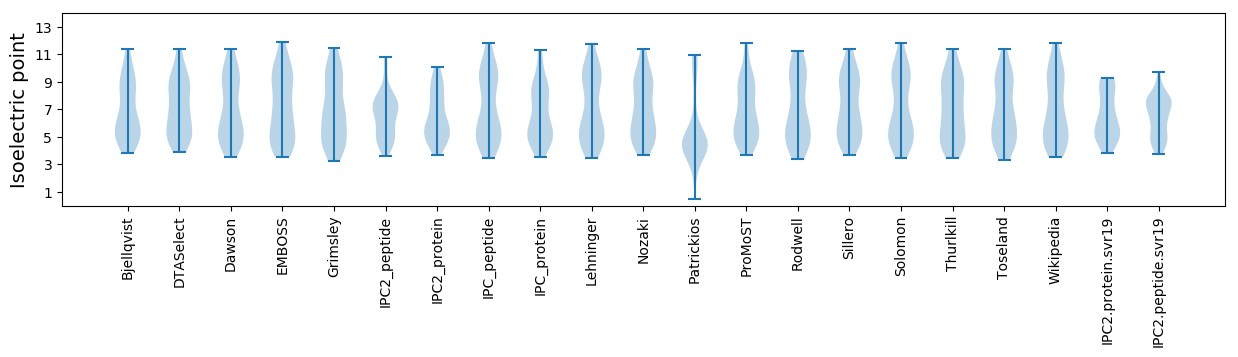
* You can choose from 21 different methods for calculating isoelectric point
Summary statistics related to proteome-wise predictions
Protein with the lowest isoelectric point:
>tr|H2DE88|H2DE88_9CAUD Uncharacterized protein OS=Erwinia phage PEp14 OX=1131315 GN=PEp14_00058 PE=4 SV=1
MM1 pKa = 7.72IEE3 pKa = 4.53TIAGWMLVIAICGPAPDD20 pKa = 4.54DD21 pKa = 4.71CRR23 pKa = 11.84DD24 pKa = 3.76EE25 pKa = 4.84PVDD28 pKa = 4.18DD29 pKa = 4.1YY30 pKa = 11.49FYY32 pKa = 10.41STKK35 pKa = 10.88AMCEE39 pKa = 4.0NLSGKK44 pKa = 8.66ATTDD48 pKa = 3.33PDD50 pKa = 4.1AVCVPVEE57 pKa = 3.43ITRR60 pKa = 11.84RR61 pKa = 11.84VEE63 pKa = 3.84APP65 pKa = 3.04
MM1 pKa = 7.72IEE3 pKa = 4.53TIAGWMLVIAICGPAPDD20 pKa = 4.54DD21 pKa = 4.71CRR23 pKa = 11.84DD24 pKa = 3.76EE25 pKa = 4.84PVDD28 pKa = 4.18DD29 pKa = 4.1YY30 pKa = 11.49FYY32 pKa = 10.41STKK35 pKa = 10.88AMCEE39 pKa = 4.0NLSGKK44 pKa = 8.66ATTDD48 pKa = 3.33PDD50 pKa = 4.1AVCVPVEE57 pKa = 3.43ITRR60 pKa = 11.84RR61 pKa = 11.84VEE63 pKa = 3.84APP65 pKa = 3.04
Molecular weight: 7.09 kDa
Isoelectric point according different methods:
Protein with the highest isoelectric point:
>tr|H2DE69|H2DE69_9CAUD Uncharacterized protein OS=Erwinia phage PEp14 OX=1131315 GN=PEp14_00039 PE=4 SV=1
MM1 pKa = 6.65MAAIKK6 pKa = 8.37THH8 pKa = 5.05TGIVVRR14 pKa = 11.84ASGRR18 pKa = 11.84KK19 pKa = 8.69RR20 pKa = 11.84VQLHH24 pKa = 4.91QSATAWIARR33 pKa = 11.84SNEE36 pKa = 3.56YY37 pKa = 10.6YY38 pKa = 10.86YY39 pKa = 10.78RR40 pKa = 11.84DD41 pKa = 2.98TGARR45 pKa = 11.84VGGYY49 pKa = 9.95GRR51 pKa = 11.84GHH53 pKa = 6.95IEE55 pKa = 4.18LDD57 pKa = 3.83SIRR60 pKa = 11.84PIAPAAAQGGAAA72 pKa = 4.27
MM1 pKa = 6.65MAAIKK6 pKa = 8.37THH8 pKa = 5.05TGIVVRR14 pKa = 11.84ASGRR18 pKa = 11.84KK19 pKa = 8.69RR20 pKa = 11.84VQLHH24 pKa = 4.91QSATAWIARR33 pKa = 11.84SNEE36 pKa = 3.56YY37 pKa = 10.6YY38 pKa = 10.86YY39 pKa = 10.78RR40 pKa = 11.84DD41 pKa = 2.98TGARR45 pKa = 11.84VGGYY49 pKa = 9.95GRR51 pKa = 11.84GHH53 pKa = 6.95IEE55 pKa = 4.18LDD57 pKa = 3.83SIRR60 pKa = 11.84PIAPAAAQGGAAA72 pKa = 4.27
Molecular weight: 7.71 kDa
Isoelectric point according different methods:
Peptides (in silico digests for buttom-up proteomics)
Below you can find in silico digests of the whole proteome with Trypsin, Chymotrypsin, Trypsin+LysC, LysN, ArgC proteases suitable for different mass spec machines.| Try ESI |
 |
|---|
| ChTry ESI |
|
|---|
| ArgC ESI |
|
|---|
| LysN ESI |
|
|---|
| TryLysC ESI |
|
|---|
| Try MALDI |
|
|---|
| ChTry MALDI |
|
|---|
| ArgC MALDI |
|
|---|
| LysN MALDI |
|
|---|
| TryLysC MALDI |
|
|---|
| Try LTQ |
|
|---|
| ChTry LTQ |
|
|---|
| ArgC LTQ |
|
|---|
| LysN LTQ |
|
|---|
| TryLysC LTQ |
|
|---|
| Try MSlow |
|
|---|
| ChTry MSlow |
|
|---|
| ArgC MSlow |
|
|---|
| LysN MSlow |
|
|---|
| TryLysC MSlow |
|
|---|
| Try MShigh |
|
|---|
| ChTry MShigh |
|
|---|
| ArgC MShigh |
|
|---|
| LysN MShigh |
|
|---|
| TryLysC MShigh |
|
|---|
General Statistics
Number of major isoforms |
Number of additional isoforms |
Number of all proteins |
Number of amino acids |
Min. Seq. Length |
Max. Seq. Length |
Avg. Seq. Length |
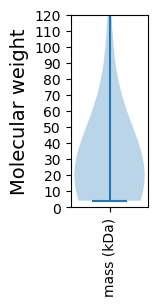
Avg. Mol. Weight |
|---|---|---|---|---|---|---|---|
0 |
19341 |
35 |
4914 |
302.2 |
33.2 |
Amino acid frequency
Ala |
Cys |
Asp |
Glu |
Phe |
Gly |
His |
Ile |
Lys |
Leu |
|---|---|---|---|---|---|---|---|---|---|
11.918 ± 0.494 | 0.62 ± 0.173 |
6.23 ± 0.244 | 6.799 ± 0.346 |
3.164 ± 0.168 | 8.143 ± 0.297 |
1.799 ± 0.154 | 3.966 ± 0.148 |
4.808 ± 0.245 | 7.435 ± 0.299 |
Met |
Asn |
Gln |
Pro |
Arg |
Ser |
Thr |
Val |
Trp |
Tyr |
|---|---|---|---|---|---|---|---|---|---|
2.808 ± 0.123 | 3.836 ± 0.172 |
5.113 ± 0.333 | 4.819 ± 0.311 |
6.68 ± 0.311 | 5.517 ± 0.206 |
5.843 ± 0.2 | 6.215 ± 0.293 |
1.742 ± 0.18 | 2.544 ± 0.131 |
Most of the basic statistics you can see at this page can be downloaded from this CSV file
See this proteome in:

Proteome-pI is available under Creative Commons Attribution-NoDerivs license, for more details see here
| Reference: Kozlowski LP. Proteome-pI 2.0: Proteome Isoelectric Point Database Update. Nucleic Acids Res. 2021, doi: 10.1093/nar/gkab944 | Contact: Lukasz P. Kozlowski |