Mycobacterium phage Smeagol
Taxonomy: Viruses; Duplodnaviria; Heunggongvirae; Uroviricota; Caudoviricetes; Caudovirales; Siphoviridae; Fromanvirus; unclassified Fromanvirus
Average proteome isoelectric point is 6.2
Get precalculated fractions of proteins
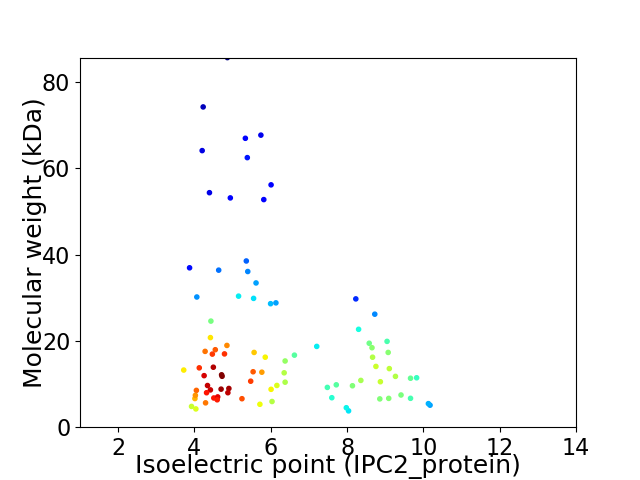
Virtual 2D-PAGE plot for 90 proteins (isoelectric point calculated using IPC2_protein)
Get csv file with sequences according to given criteria:
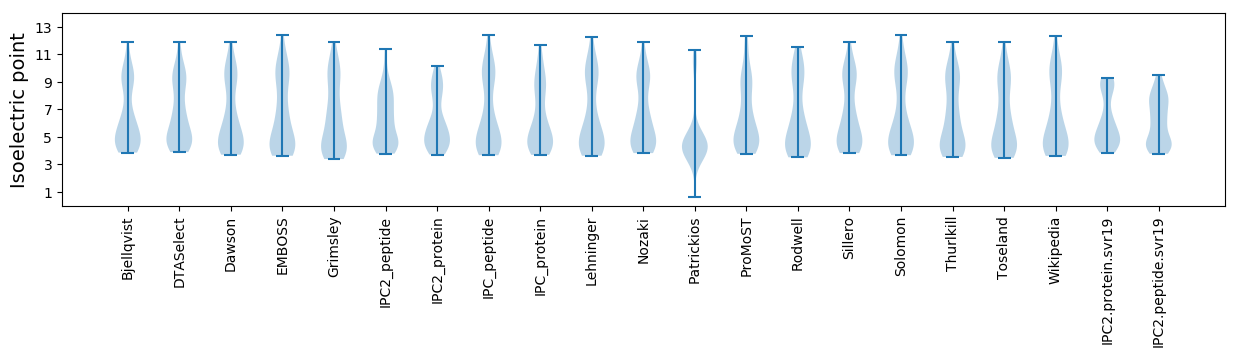
* You can choose from 21 different methods for calculating isoelectric point
Summary statistics related to proteome-wise predictions
Protein with the lowest isoelectric point:
>tr|A0A2P1JTB2|A0A2P1JTB2_9CAUD Uncharacterized protein OS=Mycobacterium phage Smeagol OX=2108131 GN=68 PE=4 SV=1
MM1 pKa = 7.93KK2 pKa = 9.35YY3 pKa = 7.78TLRR6 pKa = 11.84VFGIPVLSFEE16 pKa = 4.47SAGTGAEE23 pKa = 3.56EE24 pKa = 5.43GYY26 pKa = 10.65INLTGGSFEE35 pKa = 4.65LAPEE39 pKa = 3.98EE40 pKa = 4.15PEE42 pKa = 3.9YY43 pKa = 11.13DD44 pKa = 3.29EE45 pKa = 5.61EE46 pKa = 4.95YY47 pKa = 10.82YY48 pKa = 10.93EE49 pKa = 4.22EE50 pKa = 4.6DD51 pKa = 3.1RR52 pKa = 11.84SGFGFGVSS60 pKa = 3.28
MM1 pKa = 7.93KK2 pKa = 9.35YY3 pKa = 7.78TLRR6 pKa = 11.84VFGIPVLSFEE16 pKa = 4.47SAGTGAEE23 pKa = 3.56EE24 pKa = 5.43GYY26 pKa = 10.65INLTGGSFEE35 pKa = 4.65LAPEE39 pKa = 3.98EE40 pKa = 4.15PEE42 pKa = 3.9YY43 pKa = 11.13DD44 pKa = 3.29EE45 pKa = 5.61EE46 pKa = 4.95YY47 pKa = 10.82YY48 pKa = 10.93EE49 pKa = 4.22EE50 pKa = 4.6DD51 pKa = 3.1RR52 pKa = 11.84SGFGFGVSS60 pKa = 3.28
Molecular weight: 6.64 kDa
Isoelectric point according different methods:
Protein with the highest isoelectric point:
>tr|A0A2P1JT85|A0A2P1JT85_9CAUD Uncharacterized protein OS=Mycobacterium phage Smeagol OX=2108131 GN=37 PE=4 SV=1
MM1 pKa = 7.86RR2 pKa = 11.84EE3 pKa = 3.65LWGNDD8 pKa = 2.41ARR10 pKa = 11.84KK11 pKa = 8.79WLIRR15 pKa = 11.84KK16 pKa = 9.05SPHH19 pKa = 3.91TQEE22 pKa = 4.3WIVFPSVGSFYY33 pKa = 11.27GVITFHH39 pKa = 7.49PDD41 pKa = 3.0YY42 pKa = 10.33EE43 pKa = 4.34SARR46 pKa = 11.84AGFIRR51 pKa = 11.84QTRR54 pKa = 11.84RR55 pKa = 11.84PP56 pKa = 3.6
MM1 pKa = 7.86RR2 pKa = 11.84EE3 pKa = 3.65LWGNDD8 pKa = 2.41ARR10 pKa = 11.84KK11 pKa = 8.79WLIRR15 pKa = 11.84KK16 pKa = 9.05SPHH19 pKa = 3.91TQEE22 pKa = 4.3WIVFPSVGSFYY33 pKa = 11.27GVITFHH39 pKa = 7.49PDD41 pKa = 3.0YY42 pKa = 10.33EE43 pKa = 4.34SARR46 pKa = 11.84AGFIRR51 pKa = 11.84QTRR54 pKa = 11.84RR55 pKa = 11.84PP56 pKa = 3.6
Molecular weight: 6.69 kDa
Isoelectric point according different methods:
Peptides (in silico digests for buttom-up proteomics)
Below you can find in silico digests of the whole proteome with Trypsin, Chymotrypsin, Trypsin+LysC, LysN, ArgC proteases suitable for different mass spec machines.| Try ESI |
 |
|---|
| ChTry ESI |
|
|---|
| ArgC ESI |
|
|---|
| LysN ESI |
|
|---|
| TryLysC ESI |
|
|---|
| Try MALDI |
|
|---|
| ChTry MALDI |
|
|---|
| ArgC MALDI |
|
|---|
| LysN MALDI |
|
|---|
| TryLysC MALDI |
|
|---|
| Try LTQ |
|
|---|
| ChTry LTQ |
|
|---|
| ArgC LTQ |
|
|---|
| LysN LTQ |
|
|---|
| TryLysC LTQ |
|
|---|
| Try MSlow |
|
|---|
| ChTry MSlow |
|
|---|
| ArgC MSlow |
|
|---|
| LysN MSlow |
|
|---|
| TryLysC MSlow |
|
|---|
| Try MShigh |
|
|---|
| ChTry MShigh |
|
|---|
| ArgC MShigh |
|
|---|
| LysN MShigh |
|
|---|
| TryLysC MShigh |
|
|---|
General Statistics
Number of major isoforms |
Number of additional isoforms |
Number of all proteins |
Number of amino acids |
Min. Seq. Length |
Max. Seq. Length |
Avg. Seq. Length |
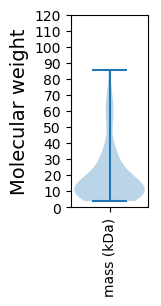
Avg. Mol. Weight |
|---|---|---|---|---|---|---|---|
0 |
16397 |
32 |
827 |
182.2 |
20.02 |
Amino acid frequency
Ala |
Cys |
Asp |
Glu |
Phe |
Gly |
His |
Ile |
Lys |
Leu |
|---|---|---|---|---|---|---|---|---|---|
10.173 ± 0.328 | 0.561 ± 0.093 |
6.69 ± 0.266 | 6.641 ± 0.278 |
3.177 ± 0.165 | 8.404 ± 0.47 |
1.952 ± 0.165 | 4.909 ± 0.215 |
4.251 ± 0.275 | 8.642 ± 0.224 |
Met |
Asn |
Gln |
Pro |
Arg |
Ser |
Thr |
Val |
Trp |
Tyr |
|---|---|---|---|---|---|---|---|---|---|
2.025 ± 0.116 | 3.116 ± 0.145 |
5.489 ± 0.229 | 3.171 ± 0.177 |
6.318 ± 0.411 | 6.001 ± 0.3 |
6.458 ± 0.307 | 7.081 ± 0.207 |
2.067 ± 0.109 | 2.872 ± 0.155 |
Most of the basic statistics you can see at this page can be downloaded from this CSV file
See this proteome in:

Proteome-pI is available under Creative Commons Attribution-NoDerivs license, for more details see here
| Reference: Kozlowski LP. Proteome-pI 2.0: Proteome Isoelectric Point Database Update. Nucleic Acids Res. 2021, doi: 10.1093/nar/gkab944 | Contact: Lukasz P. Kozlowski |