Clostridium sp. CAG:1000
Taxonomy: cellular organisms; Bacteria; Terrabacteria group; Firmicutes; Clostridia; Eubacteriales; Clostridiaceae; Clostridium; environmental samples
Average proteome isoelectric point is 6.83
Get precalculated fractions of proteins
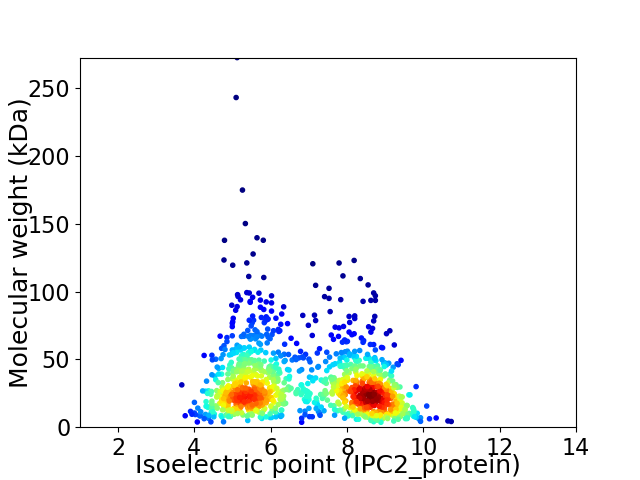
Virtual 2D-PAGE plot for 1142 proteins (isoelectric point calculated using IPC2_protein)
Get csv file with sequences according to given criteria:
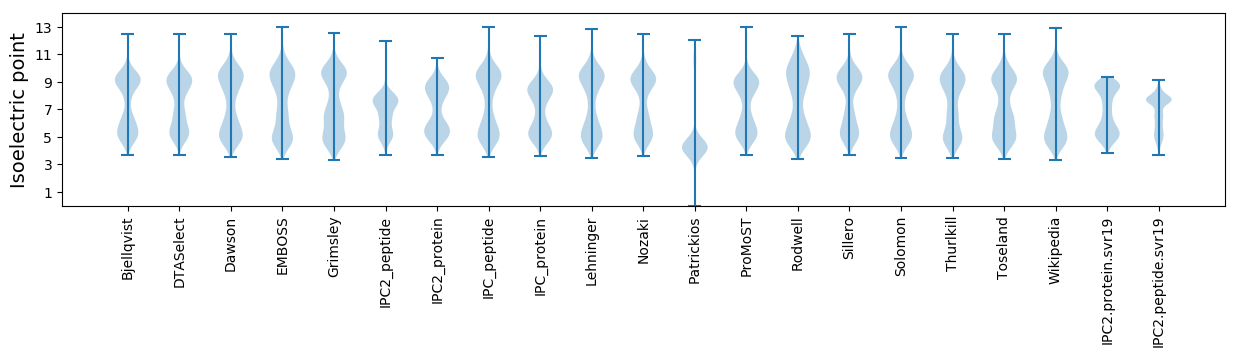
* You can choose from 21 different methods for calculating isoelectric point
Summary statistics related to proteome-wise predictions
Protein with the lowest isoelectric point:
>tr|R5A384|R5A384_9CLOT SpoIIIAH OS=Clostridium sp. CAG:1000 OX=1262768 GN=BN451_00726 PE=4 SV=1
MM1 pKa = 7.67IKK3 pKa = 10.39YY4 pKa = 9.84KK5 pKa = 10.48YY6 pKa = 9.57DD7 pKa = 3.39SEE9 pKa = 4.9VIFDD13 pKa = 4.25ISNLDD18 pKa = 3.36KK19 pKa = 11.58SEE21 pKa = 4.68LSLLYY26 pKa = 10.47DD27 pKa = 5.05AIDD30 pKa = 4.22DD31 pKa = 3.88NKK33 pKa = 10.86HH34 pKa = 5.95YY35 pKa = 10.73IDD37 pKa = 4.29IEE39 pKa = 4.21MFFIGDD45 pKa = 3.7SNIPNFGPDD54 pKa = 2.91YY55 pKa = 11.07NYY57 pKa = 10.31IVNDD61 pKa = 3.13NKK63 pKa = 11.07LILKK67 pKa = 9.4YY68 pKa = 10.56IFF70 pKa = 4.11
MM1 pKa = 7.67IKK3 pKa = 10.39YY4 pKa = 9.84KK5 pKa = 10.48YY6 pKa = 9.57DD7 pKa = 3.39SEE9 pKa = 4.9VIFDD13 pKa = 4.25ISNLDD18 pKa = 3.36KK19 pKa = 11.58SEE21 pKa = 4.68LSLLYY26 pKa = 10.47DD27 pKa = 5.05AIDD30 pKa = 4.22DD31 pKa = 3.88NKK33 pKa = 10.86HH34 pKa = 5.95YY35 pKa = 10.73IDD37 pKa = 4.29IEE39 pKa = 4.21MFFIGDD45 pKa = 3.7SNIPNFGPDD54 pKa = 2.91YY55 pKa = 11.07NYY57 pKa = 10.31IVNDD61 pKa = 3.13NKK63 pKa = 11.07LILKK67 pKa = 9.4YY68 pKa = 10.56IFF70 pKa = 4.11
Molecular weight: 8.34 kDa
Isoelectric point according different methods:
Protein with the highest isoelectric point:
>tr|R4ZZF3|R4ZZF3_9CLOT Uncharacterized protein OS=Clostridium sp. CAG:1000 OX=1262768 GN=BN451_00552 PE=3 SV=1
MM1 pKa = 7.81ANARR5 pKa = 11.84NNARR9 pKa = 11.84SNARR13 pKa = 11.84KK14 pKa = 9.57NSCKK18 pKa = 10.31AKK20 pKa = 10.62SNARR24 pKa = 11.84SNSRR28 pKa = 11.84SRR30 pKa = 11.84STSNSRR36 pKa = 11.84SRR38 pKa = 3.44
MM1 pKa = 7.81ANARR5 pKa = 11.84NNARR9 pKa = 11.84SNARR13 pKa = 11.84KK14 pKa = 9.57NSCKK18 pKa = 10.31AKK20 pKa = 10.62SNARR24 pKa = 11.84SNSRR28 pKa = 11.84SRR30 pKa = 11.84STSNSRR36 pKa = 11.84SRR38 pKa = 3.44
Molecular weight: 4.2 kDa
Isoelectric point according different methods:
Peptides (in silico digests for buttom-up proteomics)
Below you can find in silico digests of the whole proteome with Trypsin, Chymotrypsin, Trypsin+LysC, LysN, ArgC proteases suitable for different mass spec machines.| Try ESI |
 |
|---|
| ChTry ESI |
|
|---|
| ArgC ESI |
|
|---|
| LysN ESI |
|
|---|
| TryLysC ESI |
|
|---|
| Try MALDI |
|
|---|
| ChTry MALDI |
|
|---|
| ArgC MALDI |
|
|---|
| LysN MALDI |
|
|---|
| TryLysC MALDI |
|
|---|
| Try LTQ |
|
|---|
| ChTry LTQ |
|
|---|
| ArgC LTQ |
|
|---|
| LysN LTQ |
|
|---|
| TryLysC LTQ |
|
|---|
| Try MSlow |
|
|---|
| ChTry MSlow |
|
|---|
| ArgC MSlow |
|
|---|
| LysN MSlow |
|
|---|
| TryLysC MSlow |
|
|---|
| Try MShigh |
|
|---|
| ChTry MShigh |
|
|---|
| ArgC MShigh |
|
|---|
| LysN MShigh |
|
|---|
| TryLysC MShigh |
|
|---|
General Statistics
Number of major isoforms |
Number of additional isoforms |
Number of all proteins |
Number of amino acids |
Min. Seq. Length |
Max. Seq. Length |
Avg. Seq. Length |
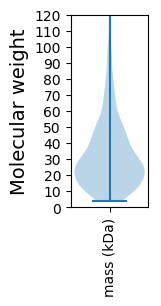
Avg. Mol. Weight |
|---|---|---|---|---|---|---|---|
0 |
342649 |
30 |
2442 |
300.0 |
34.35 |
Amino acid frequency
Ala |
Cys |
Asp |
Glu |
Phe |
Gly |
His |
Ile |
Lys |
Leu |
|---|---|---|---|---|---|---|---|---|---|
4.09 ± 0.06 | 1.195 ± 0.03 |
6.146 ± 0.058 | 6.982 ± 0.079 |
4.353 ± 0.057 | 5.211 ± 0.063 |
1.216 ± 0.023 | 10.165 ± 0.095 |
10.344 ± 0.083 | 8.889 ± 0.079 |
Met |
Asn |
Gln |
Pro |
Arg |
Ser |
Thr |
Val |
Trp |
Tyr |
|---|---|---|---|---|---|---|---|---|---|
2.391 ± 0.032 | 7.757 ± 0.089 |
2.343 ± 0.038 | 1.842 ± 0.03 |
2.989 ± 0.044 | 6.838 ± 0.061 |
5.355 ± 0.062 | 6.009 ± 0.058 |
0.522 ± 0.02 | 5.363 ± 0.079 |
Most of the basic statistics you can see at this page can be downloaded from this CSV file
See this proteome in:

Proteome-pI is available under Creative Commons Attribution-NoDerivs license, for more details see here
| Reference: Kozlowski LP. Proteome-pI 2.0: Proteome Isoelectric Point Database Update. Nucleic Acids Res. 2021, doi: 10.1093/nar/gkab944 | Contact: Lukasz P. Kozlowski |