Clostridium sp. CAG:273
Taxonomy: cellular organisms; Bacteria; Terrabacteria group; Firmicutes; Clostridia; Eubacteriales; Clostridiaceae; Clostridium; environmental samples
Average proteome isoelectric point is 6.62
Get precalculated fractions of proteins
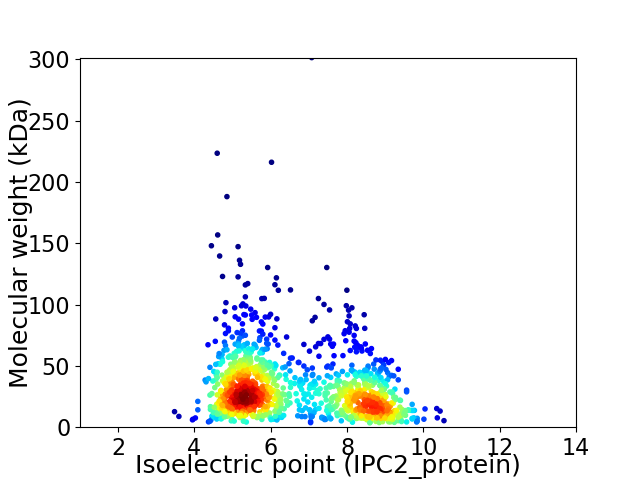
Virtual 2D-PAGE plot for 1183 proteins (isoelectric point calculated using IPC2_protein)
Get csv file with sequences according to given criteria:
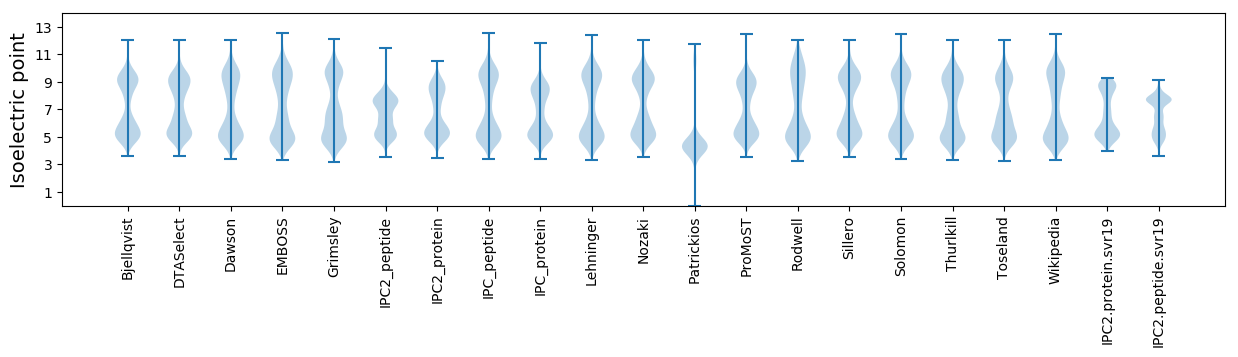
* You can choose from 21 different methods for calculating isoelectric point
Summary statistics related to proteome-wise predictions
Protein with the lowest isoelectric point:
>tr|R7L6F5|R7L6F5_9CLOT Cytidine/deoxycytidylate deaminase OS=Clostridium sp. CAG:273 OX=1262789 GN=BN581_01034 PE=4 SV=1
MM1 pKa = 7.82AYY3 pKa = 9.75KK4 pKa = 9.23ITDD7 pKa = 3.38RR8 pKa = 11.84CISCGACAAEE18 pKa = 4.71CPVNCISEE26 pKa = 4.39GDD28 pKa = 3.48GKK30 pKa = 11.08YY31 pKa = 10.41EE32 pKa = 4.07IDD34 pKa = 3.4ASQCISCGTCAGVCPVEE51 pKa = 4.66APEE54 pKa = 4.5PDD56 pKa = 3.43EE57 pKa = 4.15EE58 pKa = 4.33
MM1 pKa = 7.82AYY3 pKa = 9.75KK4 pKa = 9.23ITDD7 pKa = 3.38RR8 pKa = 11.84CISCGACAAEE18 pKa = 4.71CPVNCISEE26 pKa = 4.39GDD28 pKa = 3.48GKK30 pKa = 11.08YY31 pKa = 10.41EE32 pKa = 4.07IDD34 pKa = 3.4ASQCISCGTCAGVCPVEE51 pKa = 4.66APEE54 pKa = 4.5PDD56 pKa = 3.43EE57 pKa = 4.15EE58 pKa = 4.33
Molecular weight: 6.01 kDa
Isoelectric point according different methods:
Protein with the highest isoelectric point:
>tr|R7L5T3|R7L5T3_9CLOT Ribonuclease Y OS=Clostridium sp. CAG:273 OX=1262789 GN=rny PE=3 SV=1
MM1 pKa = 7.83AKK3 pKa = 9.58TSLKK7 pKa = 10.47VKK9 pKa = 7.57QQRR12 pKa = 11.84TQKK15 pKa = 10.65YY16 pKa = 6.33KK17 pKa = 7.88TRR19 pKa = 11.84EE20 pKa = 3.74YY21 pKa = 10.71NRR23 pKa = 11.84CKK25 pKa = 10.14ICGRR29 pKa = 11.84PHH31 pKa = 7.33AYY33 pKa = 8.2IRR35 pKa = 11.84KK36 pKa = 8.97YY37 pKa = 10.49GICRR41 pKa = 11.84LCFRR45 pKa = 11.84KK46 pKa = 9.51LAHH49 pKa = 6.45NGEE52 pKa = 4.13IPGVKK57 pKa = 9.32KK58 pKa = 10.94ASWW61 pKa = 3.03
MM1 pKa = 7.83AKK3 pKa = 9.58TSLKK7 pKa = 10.47VKK9 pKa = 7.57QQRR12 pKa = 11.84TQKK15 pKa = 10.65YY16 pKa = 6.33KK17 pKa = 7.88TRR19 pKa = 11.84EE20 pKa = 3.74YY21 pKa = 10.71NRR23 pKa = 11.84CKK25 pKa = 10.14ICGRR29 pKa = 11.84PHH31 pKa = 7.33AYY33 pKa = 8.2IRR35 pKa = 11.84KK36 pKa = 8.97YY37 pKa = 10.49GICRR41 pKa = 11.84LCFRR45 pKa = 11.84KK46 pKa = 9.51LAHH49 pKa = 6.45NGEE52 pKa = 4.13IPGVKK57 pKa = 9.32KK58 pKa = 10.94ASWW61 pKa = 3.03
Molecular weight: 7.24 kDa
Isoelectric point according different methods:
Peptides (in silico digests for buttom-up proteomics)
Below you can find in silico digests of the whole proteome with Trypsin, Chymotrypsin, Trypsin+LysC, LysN, ArgC proteases suitable for different mass spec machines.| Try ESI |
 |
|---|
| ChTry ESI |
|
|---|
| ArgC ESI |
|
|---|
| LysN ESI |
|
|---|
| TryLysC ESI |
|
|---|
| Try MALDI |
|
|---|
| ChTry MALDI |
|
|---|
| ArgC MALDI |
|
|---|
| LysN MALDI |
|
|---|
| TryLysC MALDI |
|
|---|
| Try LTQ |
|
|---|
| ChTry LTQ |
|
|---|
| ArgC LTQ |
|
|---|
| LysN LTQ |
|
|---|
| TryLysC LTQ |
|
|---|
| Try MSlow |
|
|---|
| ChTry MSlow |
|
|---|
| ArgC MSlow |
|
|---|
| LysN MSlow |
|
|---|
| TryLysC MSlow |
|
|---|
| Try MShigh |
|
|---|
| ChTry MShigh |
|
|---|
| ArgC MShigh |
|
|---|
| LysN MShigh |
|
|---|
| TryLysC MShigh |
|
|---|
General Statistics
Number of major isoforms |
Number of additional isoforms |
Number of all proteins |
Number of amino acids |
Min. Seq. Length |
Max. Seq. Length |
Avg. Seq. Length |
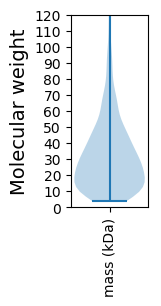
Avg. Mol. Weight |
|---|---|---|---|---|---|---|---|
0 |
354036 |
29 |
2609 |
299.3 |
33.99 |
Amino acid frequency
Ala |
Cys |
Asp |
Glu |
Phe |
Gly |
His |
Ile |
Lys |
Leu |
|---|---|---|---|---|---|---|---|---|---|
5.316 ± 0.058 | 1.075 ± 0.027 |
5.489 ± 0.061 | 8.164 ± 0.085 |
3.799 ± 0.045 | 5.841 ± 0.071 |
1.191 ± 0.024 | 10.284 ± 0.106 |
9.81 ± 0.082 | 8.31 ± 0.07 |
Met |
Asn |
Gln |
Pro |
Arg |
Ser |
Thr |
Val |
Trp |
Tyr |
|---|---|---|---|---|---|---|---|---|---|
2.447 ± 0.031 | 7.269 ± 0.086 |
2.635 ± 0.044 | 2.666 ± 0.033 |
3.306 ± 0.052 | 5.641 ± 0.061 |
5.498 ± 0.059 | 6.247 ± 0.055 |
0.618 ± 0.021 | 4.375 ± 0.057 |
Most of the basic statistics you can see at this page can be downloaded from this CSV file
See this proteome in:

Proteome-pI is available under Creative Commons Attribution-NoDerivs license, for more details see here
| Reference: Kozlowski LP. Proteome-pI 2.0: Proteome Isoelectric Point Database Update. Nucleic Acids Res. 2021, doi: 10.1093/nar/gkab944 | Contact: Lukasz P. Kozlowski |