Thiovulum sp. ES
Taxonomy: cellular organisms; Bacteria; Proteobacteria; delta/epsilon subdivisions; Epsilonproteobacteria; Campylobacterales; Thiovulaceae; Thiovulum; unclassified Thiovulum
Average proteome isoelectric point is 6.43
Get precalculated fractions of proteins
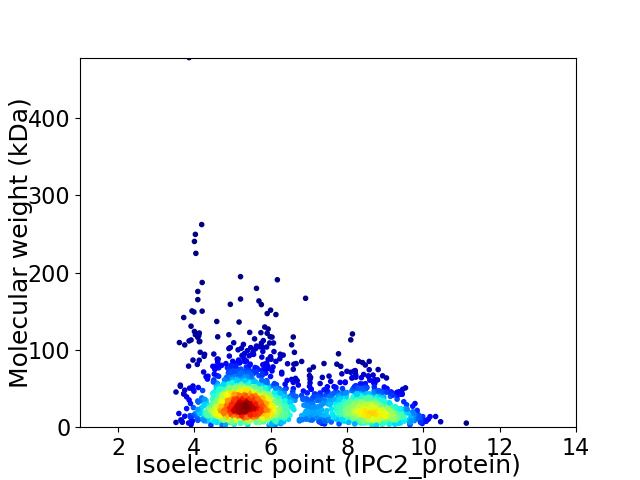
Virtual 2D-PAGE plot for 2104 proteins (isoelectric point calculated using IPC2_protein)
Get csv file with sequences according to given criteria:
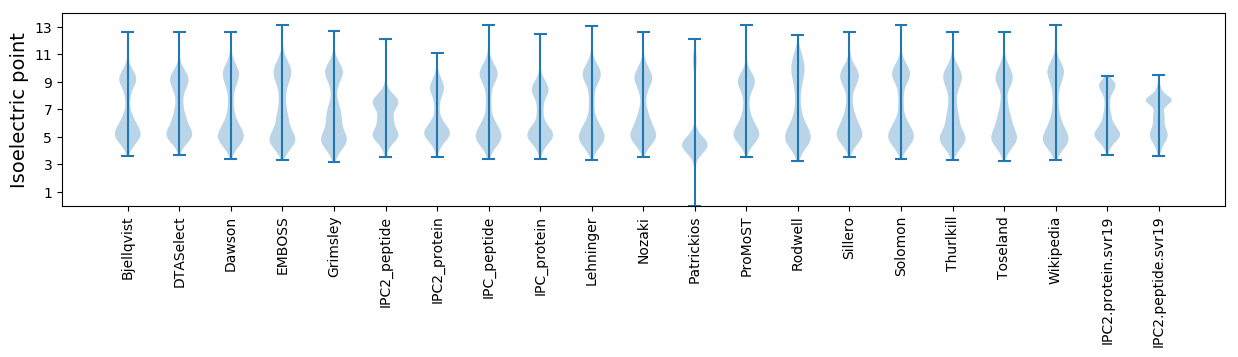
* You can choose from 21 different methods for calculating isoelectric point
Summary statistics related to proteome-wise predictions
Protein with the lowest isoelectric point:
>tr|J0L8H2|J0L8H2_9PROT 3-oxoacyl-[acyl-carrier-protein] synthase 2 OS=Thiovulum sp. ES OX=1177931 GN=ThvES_00001340 PE=3 SV=1
MM1 pKa = 7.52KK2 pKa = 10.44NISLVVATLLVSSSTLFAEE21 pKa = 4.93DD22 pKa = 4.82NKK24 pKa = 10.98NDD26 pKa = 3.51WEE28 pKa = 4.31FSGNLRR34 pKa = 11.84TGYY37 pKa = 8.08TAEE40 pKa = 4.45TVDD43 pKa = 4.7APNTDD48 pKa = 3.07SVTNTGAATGGWLTLQTPKK67 pKa = 10.74VNTFSVTASLFTSQILMGQKK87 pKa = 10.07SDD89 pKa = 3.01WWLHH93 pKa = 5.27SGGAGEE99 pKa = 4.77TNGKK103 pKa = 9.89SYY105 pKa = 10.35TYY107 pKa = 10.32FGEE110 pKa = 4.48AYY112 pKa = 9.64ISGEE116 pKa = 4.18LFSSDD121 pKa = 4.09SIIGKK126 pKa = 8.01TDD128 pKa = 2.77ITIGRR133 pKa = 11.84KK134 pKa = 9.61VIEE137 pKa = 4.35TPFANSDD144 pKa = 3.85DD145 pKa = 4.15MGMSPDD151 pKa = 3.63SFEE154 pKa = 5.58LAMLQANPIEE164 pKa = 4.35NLTVIAARR172 pKa = 11.84ATKK175 pKa = 10.13IGGYY179 pKa = 9.16DD180 pKa = 3.32APLAGAKK187 pKa = 10.28SKK189 pKa = 11.56DD190 pKa = 3.45EE191 pKa = 4.19FVEE194 pKa = 4.19LTQGDD199 pKa = 4.42GVSIVAGLYY208 pKa = 9.72SDD210 pKa = 4.44EE211 pKa = 4.28EE212 pKa = 4.81AGISAQAWNYY222 pKa = 10.46YY223 pKa = 10.46LDD225 pKa = 4.83DD226 pKa = 3.8VDD228 pKa = 4.99GAGLNMSLTYY238 pKa = 10.95ADD240 pKa = 4.56FVYY243 pKa = 10.42TMSLSEE249 pKa = 4.42DD250 pKa = 3.27MSVSVGAEE258 pKa = 3.41YY259 pKa = 11.26GLFQEE264 pKa = 5.61LNFDD268 pKa = 4.02EE269 pKa = 5.64KK270 pKa = 11.16DD271 pKa = 3.37GSLVGGKK278 pKa = 9.12IEE280 pKa = 5.06ASISDD285 pKa = 4.19LSLGVAMDD293 pKa = 4.01TASGDD298 pKa = 3.37IAPQGGFSFAPYY310 pKa = 8.41YY311 pKa = 10.31TIANIYY317 pKa = 8.31LTIAAPGVTDD327 pKa = 3.56ITAFSGKK334 pKa = 9.95ADD336 pKa = 3.68YY337 pKa = 10.66QVTEE341 pKa = 4.2EE342 pKa = 4.64LSLSALYY349 pKa = 8.04MTMSSDD355 pKa = 4.49NLDD358 pKa = 4.43DD359 pKa = 4.66DD360 pKa = 3.72WSEE363 pKa = 4.12VDD365 pKa = 4.76LSASYY370 pKa = 10.77SVSDD374 pKa = 5.26DD375 pKa = 3.81LALDD379 pKa = 4.46LYY381 pKa = 10.09MATWNEE387 pKa = 3.95GEE389 pKa = 4.29KK390 pKa = 11.0DD391 pKa = 3.46FTRR394 pKa = 11.84YY395 pKa = 8.43TIFANYY401 pKa = 10.17SFF403 pKa = 4.57
MM1 pKa = 7.52KK2 pKa = 10.44NISLVVATLLVSSSTLFAEE21 pKa = 4.93DD22 pKa = 4.82NKK24 pKa = 10.98NDD26 pKa = 3.51WEE28 pKa = 4.31FSGNLRR34 pKa = 11.84TGYY37 pKa = 8.08TAEE40 pKa = 4.45TVDD43 pKa = 4.7APNTDD48 pKa = 3.07SVTNTGAATGGWLTLQTPKK67 pKa = 10.74VNTFSVTASLFTSQILMGQKK87 pKa = 10.07SDD89 pKa = 3.01WWLHH93 pKa = 5.27SGGAGEE99 pKa = 4.77TNGKK103 pKa = 9.89SYY105 pKa = 10.35TYY107 pKa = 10.32FGEE110 pKa = 4.48AYY112 pKa = 9.64ISGEE116 pKa = 4.18LFSSDD121 pKa = 4.09SIIGKK126 pKa = 8.01TDD128 pKa = 2.77ITIGRR133 pKa = 11.84KK134 pKa = 9.61VIEE137 pKa = 4.35TPFANSDD144 pKa = 3.85DD145 pKa = 4.15MGMSPDD151 pKa = 3.63SFEE154 pKa = 5.58LAMLQANPIEE164 pKa = 4.35NLTVIAARR172 pKa = 11.84ATKK175 pKa = 10.13IGGYY179 pKa = 9.16DD180 pKa = 3.32APLAGAKK187 pKa = 10.28SKK189 pKa = 11.56DD190 pKa = 3.45EE191 pKa = 4.19FVEE194 pKa = 4.19LTQGDD199 pKa = 4.42GVSIVAGLYY208 pKa = 9.72SDD210 pKa = 4.44EE211 pKa = 4.28EE212 pKa = 4.81AGISAQAWNYY222 pKa = 10.46YY223 pKa = 10.46LDD225 pKa = 4.83DD226 pKa = 3.8VDD228 pKa = 4.99GAGLNMSLTYY238 pKa = 10.95ADD240 pKa = 4.56FVYY243 pKa = 10.42TMSLSEE249 pKa = 4.42DD250 pKa = 3.27MSVSVGAEE258 pKa = 3.41YY259 pKa = 11.26GLFQEE264 pKa = 5.61LNFDD268 pKa = 4.02EE269 pKa = 5.64KK270 pKa = 11.16DD271 pKa = 3.37GSLVGGKK278 pKa = 9.12IEE280 pKa = 5.06ASISDD285 pKa = 4.19LSLGVAMDD293 pKa = 4.01TASGDD298 pKa = 3.37IAPQGGFSFAPYY310 pKa = 8.41YY311 pKa = 10.31TIANIYY317 pKa = 8.31LTIAAPGVTDD327 pKa = 3.56ITAFSGKK334 pKa = 9.95ADD336 pKa = 3.68YY337 pKa = 10.66QVTEE341 pKa = 4.2EE342 pKa = 4.64LSLSALYY349 pKa = 8.04MTMSSDD355 pKa = 4.49NLDD358 pKa = 4.43DD359 pKa = 4.66DD360 pKa = 3.72WSEE363 pKa = 4.12VDD365 pKa = 4.76LSASYY370 pKa = 10.77SVSDD374 pKa = 5.26DD375 pKa = 3.81LALDD379 pKa = 4.46LYY381 pKa = 10.09MATWNEE387 pKa = 3.95GEE389 pKa = 4.29KK390 pKa = 11.0DD391 pKa = 3.46FTRR394 pKa = 11.84YY395 pKa = 8.43TIFANYY401 pKa = 10.17SFF403 pKa = 4.57
Molecular weight: 43.21 kDa
Isoelectric point according different methods:
Protein with the highest isoelectric point:
>tr|J0UXR4|J0UXR4_9PROT Histidine kinase OS=Thiovulum sp. ES OX=1177931 GN=ThvES_00013220 PE=4 SV=1
MM1 pKa = 7.28KK2 pKa = 9.44RR3 pKa = 11.84TYY5 pKa = 10.04QPHH8 pKa = 4.86NTPRR12 pKa = 11.84KK13 pKa = 7.34RR14 pKa = 11.84THH16 pKa = 6.22GFRR19 pKa = 11.84TRR21 pKa = 11.84MKK23 pKa = 8.5TKK25 pKa = 9.48NGRR28 pKa = 11.84RR29 pKa = 11.84VISARR34 pKa = 11.84RR35 pKa = 11.84AKK37 pKa = 9.87GRR39 pKa = 11.84KK40 pKa = 8.75RR41 pKa = 11.84LAVV44 pKa = 3.41
MM1 pKa = 7.28KK2 pKa = 9.44RR3 pKa = 11.84TYY5 pKa = 10.04QPHH8 pKa = 4.86NTPRR12 pKa = 11.84KK13 pKa = 7.34RR14 pKa = 11.84THH16 pKa = 6.22GFRR19 pKa = 11.84TRR21 pKa = 11.84MKK23 pKa = 8.5TKK25 pKa = 9.48NGRR28 pKa = 11.84RR29 pKa = 11.84VISARR34 pKa = 11.84RR35 pKa = 11.84AKK37 pKa = 9.87GRR39 pKa = 11.84KK40 pKa = 8.75RR41 pKa = 11.84LAVV44 pKa = 3.41
Molecular weight: 5.3 kDa
Isoelectric point according different methods:
Peptides (in silico digests for buttom-up proteomics)
Below you can find in silico digests of the whole proteome with Trypsin, Chymotrypsin, Trypsin+LysC, LysN, ArgC proteases suitable for different mass spec machines.| Try ESI |
 |
|---|
| ChTry ESI |
|
|---|
| ArgC ESI |
|
|---|
| LysN ESI |
|
|---|
| TryLysC ESI |
|
|---|
| Try MALDI |
|
|---|
| ChTry MALDI |
|
|---|
| ArgC MALDI |
|
|---|
| LysN MALDI |
|
|---|
| TryLysC MALDI |
|
|---|
| Try LTQ |
|
|---|
| ChTry LTQ |
|
|---|
| ArgC LTQ |
|
|---|
| LysN LTQ |
|
|---|
| TryLysC LTQ |
|
|---|
| Try MSlow |
|
|---|
| ChTry MSlow |
|
|---|
| ArgC MSlow |
|
|---|
| LysN MSlow |
|
|---|
| TryLysC MSlow |
|
|---|
| Try MShigh |
|
|---|
| ChTry MShigh |
|
|---|
| ArgC MShigh |
|
|---|
| LysN MShigh |
|
|---|
| TryLysC MShigh |
|
|---|
General Statistics
Number of major isoforms |
Number of additional isoforms |
Number of all proteins |
Number of amino acids |
Min. Seq. Length |
Max. Seq. Length |
Avg. Seq. Length |
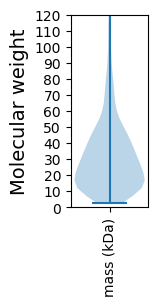
Avg. Mol. Weight |
|---|---|---|---|---|---|---|---|
0 |
632618 |
22 |
4349 |
300.7 |
34.16 |
Amino acid frequency
Ala |
Cys |
Asp |
Glu |
Phe |
Gly |
His |
Ile |
Lys |
Leu |
|---|---|---|---|---|---|---|---|---|---|
5.005 ± 0.071 | 0.543 ± 0.016 |
5.792 ± 0.05 | 8.525 ± 0.063 |
5.7 ± 0.056 | 6.097 ± 0.071 |
1.557 ± 0.025 | 8.504 ± 0.055 |
8.701 ± 0.084 | 9.235 ± 0.061 |
Met |
Asn |
Gln |
Pro |
Arg |
Ser |
Thr |
Val |
Trp |
Tyr |
|---|---|---|---|---|---|---|---|---|---|
2.003 ± 0.027 | 5.813 ± 0.049 |
2.78 ± 0.03 | 2.772 ± 0.026 |
3.815 ± 0.042 | 7.634 ± 0.064 |
5.166 ± 0.071 | 6.059 ± 0.04 |
0.794 ± 0.018 | 3.504 ± 0.039 |
Most of the basic statistics you can see at this page can be downloaded from this CSV file
See this proteome in:

Proteome-pI is available under Creative Commons Attribution-NoDerivs license, for more details see here
| Reference: Kozlowski LP. Proteome-pI 2.0: Proteome Isoelectric Point Database Update. Nucleic Acids Res. 2021, doi: 10.1093/nar/gkab944 | Contact: Lukasz P. Kozlowski |