Brochothrix phage A9
Taxonomy: Viruses; Duplodnaviria; Heunggongvirae; Uroviricota; Caudoviricetes; Caudovirales; Herelleviridae; Brochothrix virus A9
Average proteome isoelectric point is 6.3
Get precalculated fractions of proteins
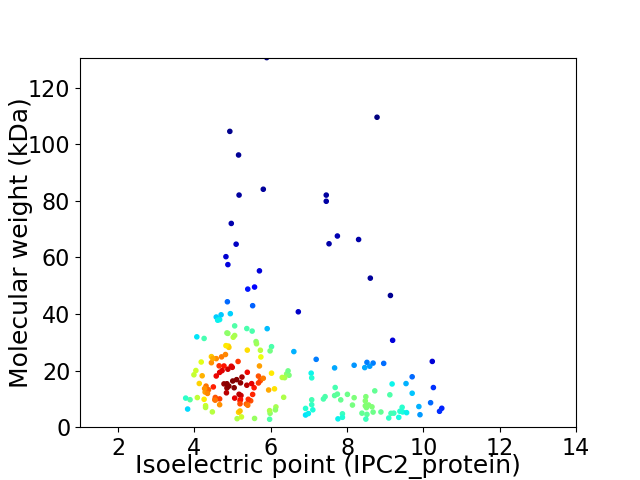
Virtual 2D-PAGE plot for 199 proteins (isoelectric point calculated using IPC2_protein)
Get csv file with sequences according to given criteria:
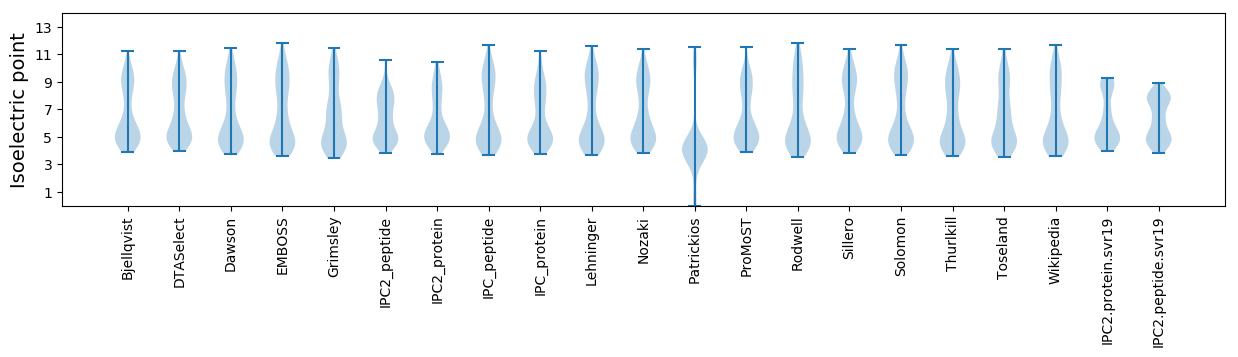
* You can choose from 21 different methods for calculating isoelectric point
Summary statistics related to proteome-wise predictions
Protein with the lowest isoelectric point:
>tr|D9J0H2|D9J0H2_9CAUD Gp25 OS=Brochothrix phage A9 OX=857312 PE=4 SV=1
MM1 pKa = 8.21IIEE4 pKa = 4.37ITNSYY9 pKa = 10.17HH10 pKa = 5.02GTTEE14 pKa = 3.67IVEE17 pKa = 4.29DD18 pKa = 4.23EE19 pKa = 4.29SLEE22 pKa = 4.2VAKK25 pKa = 10.72NKK27 pKa = 10.12HH28 pKa = 5.07ISGLEE33 pKa = 3.85VTAGNLAEE41 pKa = 5.27NEE43 pKa = 4.44VEE45 pKa = 5.59DD46 pKa = 5.15DD47 pKa = 3.23WADD50 pKa = 3.46YY51 pKa = 10.01YY52 pKa = 11.07ATYY55 pKa = 10.76EE56 pKa = 4.07EE57 pKa = 5.35AEE59 pKa = 4.06QATYY63 pKa = 11.44DD64 pKa = 5.46DD65 pKa = 4.98ILNQLKK71 pKa = 10.7SEE73 pKa = 4.25VAYY76 pKa = 9.74KK77 pKa = 10.69VIEE80 pKa = 3.9QPMTIRR86 pKa = 11.84EE87 pKa = 4.11VMASVTEE94 pKa = 4.26YY95 pKa = 10.92KK96 pKa = 10.84DD97 pKa = 3.18EE98 pKa = 4.56ADD100 pKa = 3.74YY101 pKa = 10.4TKK103 pKa = 10.82HH104 pKa = 6.03EE105 pKa = 4.26NEE107 pKa = 4.13TLEE110 pKa = 4.33EE111 pKa = 4.01LLEE114 pKa = 4.42SDD116 pKa = 4.05FTHH119 pKa = 7.91DD120 pKa = 3.18ITPRR124 pKa = 11.84TYY126 pKa = 11.12NGASDD131 pKa = 3.21IAHH134 pKa = 6.1FHH136 pKa = 6.47EE137 pKa = 5.03LTPEE141 pKa = 4.44TIYY144 pKa = 11.23NALQRR149 pKa = 11.84DD150 pKa = 3.74MKK152 pKa = 10.46EE153 pKa = 4.0TDD155 pKa = 3.63FHH157 pKa = 8.01NDD159 pKa = 2.27IVEE162 pKa = 4.18YY163 pKa = 10.9DD164 pKa = 4.47DD165 pKa = 5.81DD166 pKa = 4.35LQGLSEE172 pKa = 4.79HH173 pKa = 6.72EE174 pKa = 4.55LLIQYY179 pKa = 9.24IEE181 pKa = 4.19CYY183 pKa = 10.39YY184 pKa = 10.8RR185 pKa = 11.84VFTLNGHH192 pKa = 7.16LYY194 pKa = 8.27ITNKK198 pKa = 10.16
MM1 pKa = 8.21IIEE4 pKa = 4.37ITNSYY9 pKa = 10.17HH10 pKa = 5.02GTTEE14 pKa = 3.67IVEE17 pKa = 4.29DD18 pKa = 4.23EE19 pKa = 4.29SLEE22 pKa = 4.2VAKK25 pKa = 10.72NKK27 pKa = 10.12HH28 pKa = 5.07ISGLEE33 pKa = 3.85VTAGNLAEE41 pKa = 5.27NEE43 pKa = 4.44VEE45 pKa = 5.59DD46 pKa = 5.15DD47 pKa = 3.23WADD50 pKa = 3.46YY51 pKa = 10.01YY52 pKa = 11.07ATYY55 pKa = 10.76EE56 pKa = 4.07EE57 pKa = 5.35AEE59 pKa = 4.06QATYY63 pKa = 11.44DD64 pKa = 5.46DD65 pKa = 4.98ILNQLKK71 pKa = 10.7SEE73 pKa = 4.25VAYY76 pKa = 9.74KK77 pKa = 10.69VIEE80 pKa = 3.9QPMTIRR86 pKa = 11.84EE87 pKa = 4.11VMASVTEE94 pKa = 4.26YY95 pKa = 10.92KK96 pKa = 10.84DD97 pKa = 3.18EE98 pKa = 4.56ADD100 pKa = 3.74YY101 pKa = 10.4TKK103 pKa = 10.82HH104 pKa = 6.03EE105 pKa = 4.26NEE107 pKa = 4.13TLEE110 pKa = 4.33EE111 pKa = 4.01LLEE114 pKa = 4.42SDD116 pKa = 4.05FTHH119 pKa = 7.91DD120 pKa = 3.18ITPRR124 pKa = 11.84TYY126 pKa = 11.12NGASDD131 pKa = 3.21IAHH134 pKa = 6.1FHH136 pKa = 6.47EE137 pKa = 5.03LTPEE141 pKa = 4.44TIYY144 pKa = 11.23NALQRR149 pKa = 11.84DD150 pKa = 3.74MKK152 pKa = 10.46EE153 pKa = 4.0TDD155 pKa = 3.63FHH157 pKa = 8.01NDD159 pKa = 2.27IVEE162 pKa = 4.18YY163 pKa = 10.9DD164 pKa = 4.47DD165 pKa = 5.81DD166 pKa = 4.35LQGLSEE172 pKa = 4.79HH173 pKa = 6.72EE174 pKa = 4.55LLIQYY179 pKa = 9.24IEE181 pKa = 4.19CYY183 pKa = 10.39YY184 pKa = 10.8RR185 pKa = 11.84VFTLNGHH192 pKa = 7.16LYY194 pKa = 8.27ITNKK198 pKa = 10.16
Molecular weight: 23.05 kDa
Isoelectric point according different methods:
Protein with the highest isoelectric point:
>tr|D9J0K8|D9J0K8_9CAUD Gp61 OS=Brochothrix phage A9 OX=857312 PE=4 SV=1
MM1 pKa = 7.64SYY3 pKa = 11.09YY4 pKa = 10.08IGLLFKK10 pKa = 10.65ALNWATCTITTLSQTGLVSFSAKK33 pKa = 10.02RR34 pKa = 11.84LVGLPSATLAPTNAVKK50 pKa = 10.29AYY52 pKa = 8.83PSQRR56 pKa = 11.84CLLYY60 pKa = 10.47AKK62 pKa = 9.93RR63 pKa = 11.84VMCIILGTVHH73 pKa = 6.6VPFTSTGVFSTSTLASLDD91 pKa = 3.3LRR93 pKa = 11.84KK94 pKa = 9.8PFLEE98 pKa = 5.29AIATRR103 pKa = 11.84LDD105 pKa = 3.06MRR107 pKa = 11.84TYY109 pKa = 10.42ATVPLLAVLKK119 pKa = 8.37QFCTRR124 pKa = 11.84FLRR127 pKa = 11.84LPSKK131 pKa = 10.52DD132 pKa = 3.76LNGLLLYY139 pKa = 10.17II140 pKa = 4.99
MM1 pKa = 7.64SYY3 pKa = 11.09YY4 pKa = 10.08IGLLFKK10 pKa = 10.65ALNWATCTITTLSQTGLVSFSAKK33 pKa = 10.02RR34 pKa = 11.84LVGLPSATLAPTNAVKK50 pKa = 10.29AYY52 pKa = 8.83PSQRR56 pKa = 11.84CLLYY60 pKa = 10.47AKK62 pKa = 9.93RR63 pKa = 11.84VMCIILGTVHH73 pKa = 6.6VPFTSTGVFSTSTLASLDD91 pKa = 3.3LRR93 pKa = 11.84KK94 pKa = 9.8PFLEE98 pKa = 5.29AIATRR103 pKa = 11.84LDD105 pKa = 3.06MRR107 pKa = 11.84TYY109 pKa = 10.42ATVPLLAVLKK119 pKa = 8.37QFCTRR124 pKa = 11.84FLRR127 pKa = 11.84LPSKK131 pKa = 10.52DD132 pKa = 3.76LNGLLLYY139 pKa = 10.17II140 pKa = 4.99
Molecular weight: 15.43 kDa
Isoelectric point according different methods:
Peptides (in silico digests for buttom-up proteomics)
Below you can find in silico digests of the whole proteome with Trypsin, Chymotrypsin, Trypsin+LysC, LysN, ArgC proteases suitable for different mass spec machines.| Try ESI |
 |
|---|
| ChTry ESI |
|
|---|
| ArgC ESI |
|
|---|
| LysN ESI |
|
|---|
| TryLysC ESI |
|
|---|
| Try MALDI |
|
|---|
| ChTry MALDI |
|
|---|
| ArgC MALDI |
|
|---|
| LysN MALDI |
|
|---|
| TryLysC MALDI |
|
|---|
| Try LTQ |
|
|---|
| ChTry LTQ |
|
|---|
| ArgC LTQ |
|
|---|
| LysN LTQ |
|
|---|
| TryLysC LTQ |
|
|---|
| Try MSlow |
|
|---|
| ChTry MSlow |
|
|---|
| ArgC MSlow |
|
|---|
| LysN MSlow |
|
|---|
| TryLysC MSlow |
|
|---|
| Try MShigh |
|
|---|
| ChTry MShigh |
|
|---|
| ArgC MShigh |
|
|---|
| LysN MShigh |
|
|---|
| TryLysC MShigh |
|
|---|
General Statistics
Number of major isoforms |
Number of additional isoforms |
Number of all proteins |
Number of amino acids |
Min. Seq. Length |
Max. Seq. Length |
Avg. Seq. Length |
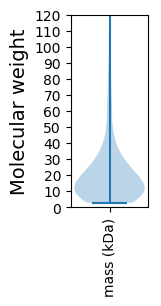
Avg. Mol. Weight |
|---|---|---|---|---|---|---|---|
0 |
38591 |
25 |
1191 |
193.9 |
21.8 |
Amino acid frequency
Ala |
Cys |
Asp |
Glu |
Phe |
Gly |
His |
Ile |
Lys |
Leu |
|---|---|---|---|---|---|---|---|---|---|
6.509 ± 0.179 | 0.749 ± 0.067 |
6.009 ± 0.168 | 7.294 ± 0.289 |
3.475 ± 0.139 | 6.266 ± 0.258 |
1.969 ± 0.105 | 6.253 ± 0.149 |
6.789 ± 0.181 | 8.73 ± 0.215 |
Met |
Asn |
Gln |
Pro |
Arg |
Ser |
Thr |
Val |
Trp |
Tyr |
|---|---|---|---|---|---|---|---|---|---|
2.514 ± 0.088 | 4.97 ± 0.159 |
3.503 ± 0.13 | 3.296 ± 0.184 |
4.395 ± 0.133 | 6.717 ± 0.196 |
7.292 ± 0.209 | 7.787 ± 0.225 |
0.935 ± 0.054 | 4.548 ± 0.168 |
Most of the basic statistics you can see at this page can be downloaded from this CSV file
See this proteome in:

Proteome-pI is available under Creative Commons Attribution-NoDerivs license, for more details see here
| Reference: Kozlowski LP. Proteome-pI 2.0: Proteome Isoelectric Point Database Update. Nucleic Acids Res. 2021, doi: 10.1093/nar/gkab944 | Contact: Lukasz P. Kozlowski |