Frankia canadensis
Taxonomy: cellular organisms; Bacteria; Terrabacteria group; Actinobacteria; Actinomycetia; Frankiales; Frankiaceae; Frankia
Average proteome isoelectric point is 6.81
Get precalculated fractions of proteins
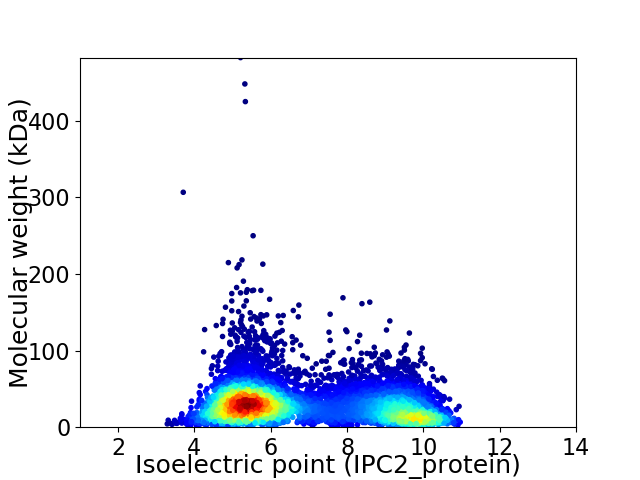
Virtual 2D-PAGE plot for 7042 proteins (isoelectric point calculated using IPC2_protein)
Get csv file with sequences according to given criteria:
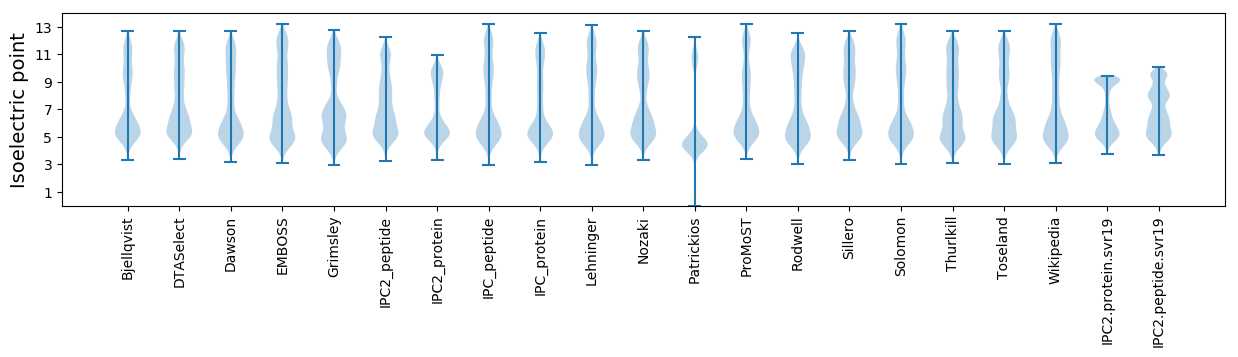
* You can choose from 21 different methods for calculating isoelectric point
Summary statistics related to proteome-wise predictions
Protein with the lowest isoelectric point:
>tr|A0A2I2KPJ2|A0A2I2KPJ2_9ACTN PemK-like protein OS=Frankia canadensis OX=1836972 GN=FRACA_1960010 PE=4 SV=1
MM1 pKa = 7.4ATPAKK6 pKa = 9.72PGVSADD12 pKa = 3.13LRR14 pKa = 11.84VRR16 pKa = 11.84VDD18 pKa = 3.4QGACTGDD25 pKa = 3.75GLCVQLAPSVFEE37 pKa = 4.03FDD39 pKa = 3.48VDD41 pKa = 3.27GLAYY45 pKa = 10.77VKK47 pKa = 10.85DD48 pKa = 3.87EE49 pKa = 4.4TGDD52 pKa = 3.66LQTSEE57 pKa = 3.99GAYY60 pKa = 10.32VGVPLPVVNAVLDD73 pKa = 4.22AADD76 pKa = 4.43EE77 pKa = 4.51CPGTCIYY84 pKa = 8.8VTRR87 pKa = 11.84PDD89 pKa = 3.4GTIEE93 pKa = 4.11AGGPADD99 pKa = 3.38
MM1 pKa = 7.4ATPAKK6 pKa = 9.72PGVSADD12 pKa = 3.13LRR14 pKa = 11.84VRR16 pKa = 11.84VDD18 pKa = 3.4QGACTGDD25 pKa = 3.75GLCVQLAPSVFEE37 pKa = 4.03FDD39 pKa = 3.48VDD41 pKa = 3.27GLAYY45 pKa = 10.77VKK47 pKa = 10.85DD48 pKa = 3.87EE49 pKa = 4.4TGDD52 pKa = 3.66LQTSEE57 pKa = 3.99GAYY60 pKa = 10.32VGVPLPVVNAVLDD73 pKa = 4.22AADD76 pKa = 4.43EE77 pKa = 4.51CPGTCIYY84 pKa = 8.8VTRR87 pKa = 11.84PDD89 pKa = 3.4GTIEE93 pKa = 4.11AGGPADD99 pKa = 3.38
Molecular weight: 10.07 kDa
Isoelectric point according different methods:
Protein with the highest isoelectric point:
>tr|A0A2I2KL22|A0A2I2KL22_9ACTN Uncharacterized protein OS=Frankia canadensis OX=1836972 GN=FRACA_1380004 PE=4 SV=1
MM1 pKa = 7.59AKK3 pKa = 10.27GRR5 pKa = 11.84GVPAALVVRR14 pKa = 11.84RR15 pKa = 11.84VMLARR20 pKa = 11.84VTRR23 pKa = 11.84FARR26 pKa = 11.84TGRR29 pKa = 11.84AGRR32 pKa = 11.84LVRR35 pKa = 11.84AAPVRR40 pKa = 11.84ACRR43 pKa = 11.84WLWGTALIARR53 pKa = 11.84RR54 pKa = 11.84AAVAATQQ61 pKa = 3.21
MM1 pKa = 7.59AKK3 pKa = 10.27GRR5 pKa = 11.84GVPAALVVRR14 pKa = 11.84RR15 pKa = 11.84VMLARR20 pKa = 11.84VTRR23 pKa = 11.84FARR26 pKa = 11.84TGRR29 pKa = 11.84AGRR32 pKa = 11.84LVRR35 pKa = 11.84AAPVRR40 pKa = 11.84ACRR43 pKa = 11.84WLWGTALIARR53 pKa = 11.84RR54 pKa = 11.84AAVAATQQ61 pKa = 3.21
Molecular weight: 6.61 kDa
Isoelectric point according different methods:
Peptides (in silico digests for buttom-up proteomics)
Below you can find in silico digests of the whole proteome with Trypsin, Chymotrypsin, Trypsin+LysC, LysN, ArgC proteases suitable for different mass spec machines.| Try ESI |
 |
|---|
| ChTry ESI |
|
|---|
| ArgC ESI |
|
|---|
| LysN ESI |
|
|---|
| TryLysC ESI |
|
|---|
| Try MALDI |
|
|---|
| ChTry MALDI |
|
|---|
| ArgC MALDI |
|
|---|
| LysN MALDI |
|
|---|
| TryLysC MALDI |
|
|---|
| Try LTQ |
|
|---|
| ChTry LTQ |
|
|---|
| ArgC LTQ |
|
|---|
| LysN LTQ |
|
|---|
| TryLysC LTQ |
|
|---|
| Try MSlow |
|
|---|
| ChTry MSlow |
|
|---|
| ArgC MSlow |
|
|---|
| LysN MSlow |
|
|---|
| TryLysC MSlow |
|
|---|
| Try MShigh |
|
|---|
| ChTry MShigh |
|
|---|
| ArgC MShigh |
|
|---|
| LysN MShigh |
|
|---|
| TryLysC MShigh |
|
|---|
General Statistics
Number of major isoforms |
Number of additional isoforms |
Number of all proteins |
Number of amino acids |
Min. Seq. Length |
Max. Seq. Length |
Avg. Seq. Length |
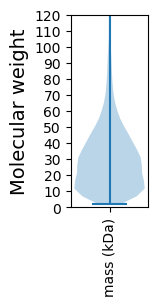
Avg. Mol. Weight |
|---|---|---|---|---|---|---|---|
0 |
2157780 |
20 |
4564 |
306.4 |
32.51 |
Amino acid frequency
Ala |
Cys |
Asp |
Glu |
Phe |
Gly |
His |
Ile |
Lys |
Leu |
|---|---|---|---|---|---|---|---|---|---|
14.636 ± 0.047 | 0.8 ± 0.009 |
6.13 ± 0.025 | 4.785 ± 0.025 |
2.529 ± 0.018 | 9.827 ± 0.031 |
2.247 ± 0.016 | 3.242 ± 0.02 |
1.24 ± 0.016 | 10.108 ± 0.034 |
Met |
Asn |
Gln |
Pro |
Arg |
Ser |
Thr |
Val |
Trp |
Tyr |
|---|---|---|---|---|---|---|---|---|---|
1.603 ± 0.011 | 1.528 ± 0.014 |
6.763 ± 0.033 | 2.504 ± 0.015 |
9.126 ± 0.031 | 5.224 ± 0.024 |
5.974 ± 0.03 | 8.548 ± 0.029 |
1.424 ± 0.011 | 1.76 ± 0.014 |
Most of the basic statistics you can see at this page can be downloaded from this CSV file
See this proteome in:

Proteome-pI is available under Creative Commons Attribution-NoDerivs license, for more details see here
| Reference: Kozlowski LP. Proteome-pI 2.0: Proteome Isoelectric Point Database Update. Nucleic Acids Res. 2021, doi: 10.1093/nar/gkab944 | Contact: Lukasz P. Kozlowski |