Alcaligenaceae bacterium
Taxonomy: cellular organisms; Bacteria; Proteobacteria; Betaproteobacteria; Burkholderiales; Alcaligenaceae; unclassified Alcaligenaceae
Average proteome isoelectric point is 6.89
Get precalculated fractions of proteins
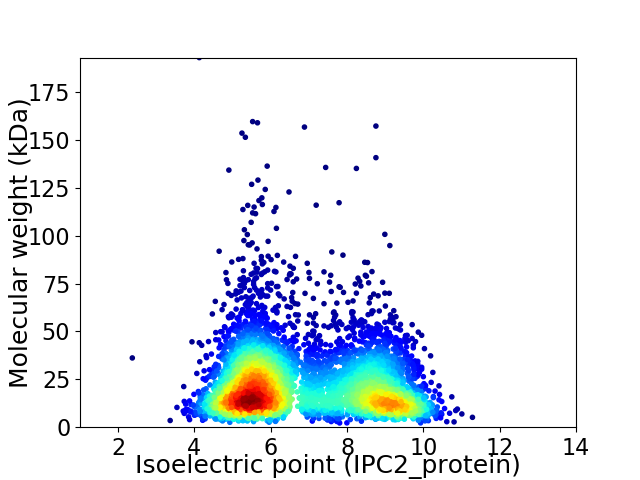
Virtual 2D-PAGE plot for 5394 proteins (isoelectric point calculated using IPC2_protein)
Get csv file with sequences according to given criteria:
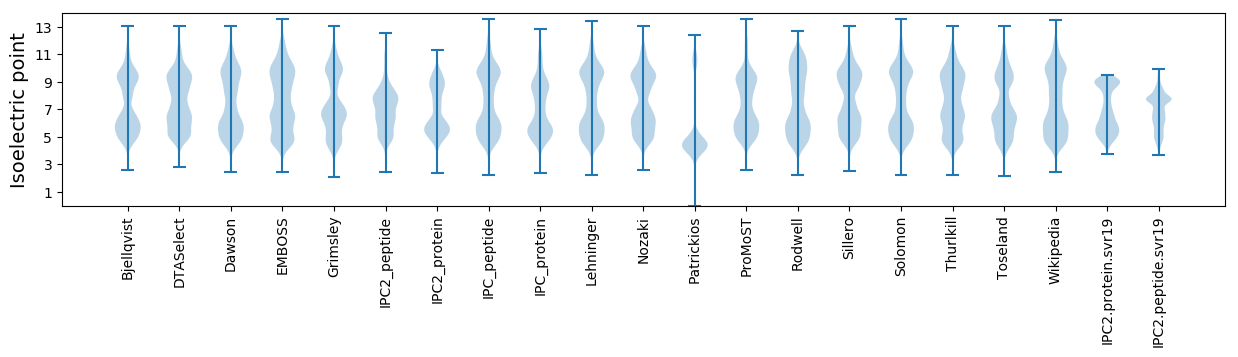
* You can choose from 21 different methods for calculating isoelectric point
Summary statistics related to proteome-wise predictions
Protein with the lowest isoelectric point:
>tr|A0A4Q4ANJ2|A0A4Q4ANJ2_9BURK Extracellular solute-binding protein (Fragment) OS=Alcaligenaceae bacterium OX=2021368 GN=EON54_12825 PE=4 SV=1
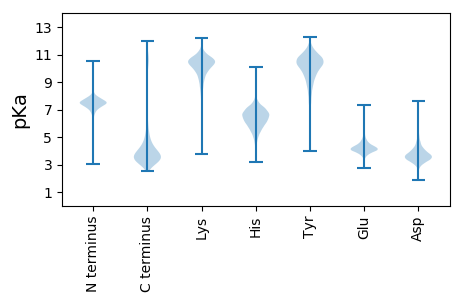
MM1 pKa = 7.57HH2 pKa = 7.12SLARR6 pKa = 11.84KK7 pKa = 9.16KK8 pKa = 10.93SSITEE13 pKa = 4.05LTSEE17 pKa = 4.5EE18 pKa = 3.45ISYY21 pKa = 10.77ISGGDD26 pKa = 3.49DD27 pKa = 3.41GGACGDD33 pKa = 4.33SGSCGAGDD41 pKa = 3.85SGSCGGDD48 pKa = 2.72GGACDD53 pKa = 3.94TGATASDD60 pKa = 3.72TSAPPSGGLTGSVIGAIGAAIGLAGAATPVGAVAAAMAALGAAISAMSNPAMGGAGTDD118 pKa = 2.94SGSNVTGNAMGDD130 pKa = 3.77LPGGPP135 pKa = 4.11
MM1 pKa = 7.57HH2 pKa = 7.12SLARR6 pKa = 11.84KK7 pKa = 9.16KK8 pKa = 10.93SSITEE13 pKa = 4.05LTSEE17 pKa = 4.5EE18 pKa = 3.45ISYY21 pKa = 10.77ISGGDD26 pKa = 3.49DD27 pKa = 3.41GGACGDD33 pKa = 4.33SGSCGAGDD41 pKa = 3.85SGSCGGDD48 pKa = 2.72GGACDD53 pKa = 3.94TGATASDD60 pKa = 3.72TSAPPSGGLTGSVIGAIGAAIGLAGAATPVGAVAAAMAALGAAISAMSNPAMGGAGTDD118 pKa = 2.94SGSNVTGNAMGDD130 pKa = 3.77LPGGPP135 pKa = 4.11
Molecular weight: 12.04 kDa
Isoelectric point according different methods:
Protein with the highest isoelectric point:
>tr|A0A4Q4AZ68|A0A4Q4AZ68_9BURK Phage tail protein OS=Alcaligenaceae bacterium OX=2021368 GN=EON54_07410 PE=4 SV=1
MM1 pKa = 7.45KK2 pKa = 9.51RR3 pKa = 11.84TFQPSVTRR11 pKa = 11.84RR12 pKa = 11.84KK13 pKa = 8.43RR14 pKa = 11.84THH16 pKa = 5.96GFRR19 pKa = 11.84ARR21 pKa = 11.84MKK23 pKa = 9.69SRR25 pKa = 11.84SGRR28 pKa = 11.84AVLSARR34 pKa = 11.84RR35 pKa = 11.84AKK37 pKa = 9.92GRR39 pKa = 11.84KK40 pKa = 8.75RR41 pKa = 11.84LAVV44 pKa = 3.41
MM1 pKa = 7.45KK2 pKa = 9.51RR3 pKa = 11.84TFQPSVTRR11 pKa = 11.84RR12 pKa = 11.84KK13 pKa = 8.43RR14 pKa = 11.84THH16 pKa = 5.96GFRR19 pKa = 11.84ARR21 pKa = 11.84MKK23 pKa = 9.69SRR25 pKa = 11.84SGRR28 pKa = 11.84AVLSARR34 pKa = 11.84RR35 pKa = 11.84AKK37 pKa = 9.92GRR39 pKa = 11.84KK40 pKa = 8.75RR41 pKa = 11.84LAVV44 pKa = 3.41
Molecular weight: 5.15 kDa
Isoelectric point according different methods:
Peptides (in silico digests for buttom-up proteomics)
Below you can find in silico digests of the whole proteome with Trypsin, Chymotrypsin, Trypsin+LysC, LysN, ArgC proteases suitable for different mass spec machines.| Try ESI |
 |
|---|
| ChTry ESI |
|
|---|
| ArgC ESI |
|
|---|
| LysN ESI |
|
|---|
| TryLysC ESI |
|
|---|
| Try MALDI |
|
|---|
| ChTry MALDI |
|
|---|
| ArgC MALDI |
|
|---|
| LysN MALDI |
|
|---|
| TryLysC MALDI |
|
|---|
| Try LTQ |
|
|---|
| ChTry LTQ |
|
|---|
| ArgC LTQ |
|
|---|
| LysN LTQ |
|
|---|
| TryLysC LTQ |
|
|---|
| Try MSlow |
|
|---|
| ChTry MSlow |
|
|---|
| ArgC MSlow |
|
|---|
| LysN MSlow |
|
|---|
| TryLysC MSlow |
|
|---|
| Try MShigh |
|
|---|
| ChTry MShigh |
|
|---|
| ArgC MShigh |
|
|---|
| LysN MShigh |
|
|---|
| TryLysC MShigh |
|
|---|
General Statistics
Number of major isoforms |
Number of additional isoforms |
Number of all proteins |
Number of amino acids |
Min. Seq. Length |
Max. Seq. Length |
Avg. Seq. Length |
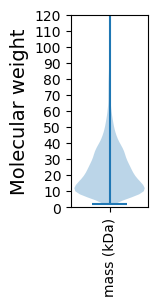
Avg. Mol. Weight |
|---|---|---|---|---|---|---|---|
0 |
1188387 |
19 |
1867 |
220.3 |
24.16 |
Amino acid frequency
Ala |
Cys |
Asp |
Glu |
Phe |
Gly |
His |
Ile |
Lys |
Leu |
|---|---|---|---|---|---|---|---|---|---|
11.198 ± 0.04 | 0.994 ± 0.012 |
5.405 ± 0.03 | 5.468 ± 0.033 |
3.708 ± 0.024 | 7.611 ± 0.035 |
2.235 ± 0.019 | 4.879 ± 0.028 |
3.913 ± 0.032 | 10.133 ± 0.041 |
Met |
Asn |
Gln |
Pro |
Arg |
Ser |
Thr |
Val |
Trp |
Tyr |
|---|---|---|---|---|---|---|---|---|---|
2.418 ± 0.017 | 3.09 ± 0.024 |
4.886 ± 0.024 | 3.861 ± 0.023 |
6.801 ± 0.033 | 6.418 ± 0.026 |
5.496 ± 0.034 | 7.479 ± 0.032 |
1.471 ± 0.018 | 2.537 ± 0.02 |
Most of the basic statistics you can see at this page can be downloaded from this CSV file
See this proteome in:

Proteome-pI is available under Creative Commons Attribution-NoDerivs license, for more details see here
| Reference: Kozlowski LP. Proteome-pI 2.0: Proteome Isoelectric Point Database Update. Nucleic Acids Res. 2021, doi: 10.1093/nar/gkab944 | Contact: Lukasz P. Kozlowski |