Roseococcus sp. SYP-B2431
Taxonomy: cellular organisms; Bacteria; Proteobacteria; Alphaproteobacteria; Rhodospirillales; Acetobacteraceae; Roseococcus; unclassified Roseococcus
Average proteome isoelectric point is 7.04
Get precalculated fractions of proteins
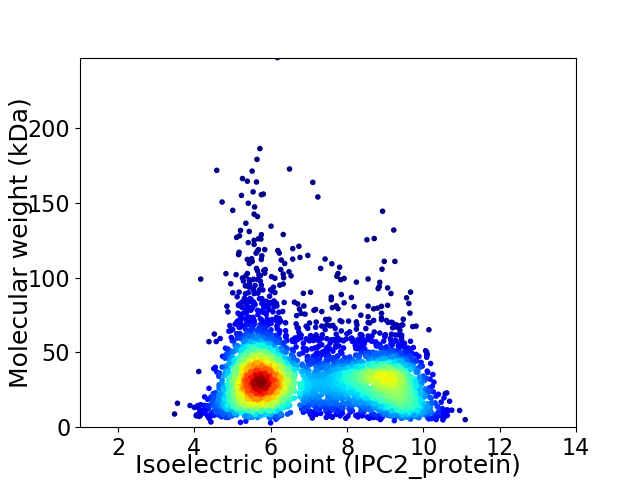
Virtual 2D-PAGE plot for 4416 proteins (isoelectric point calculated using IPC2_protein)
Get csv file with sequences according to given criteria:
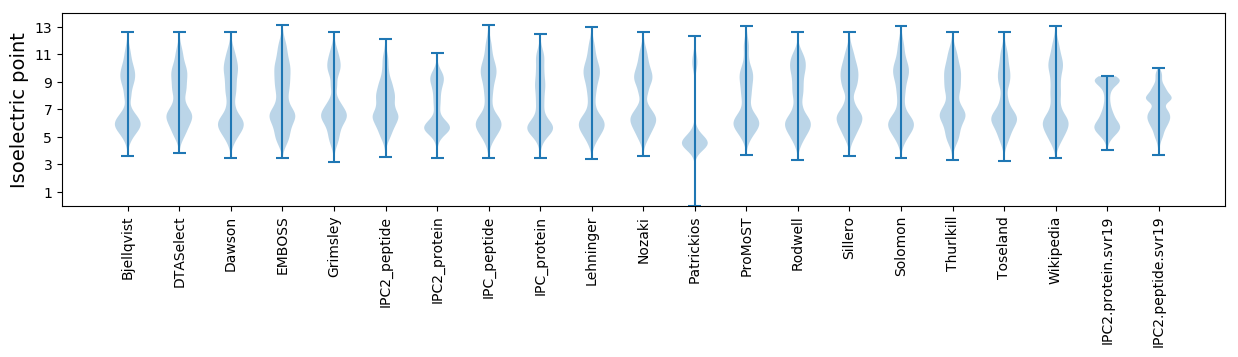
* You can choose from 21 different methods for calculating isoelectric point
Summary statistics related to proteome-wise predictions
Protein with the lowest isoelectric point:
>tr|A0A4R0YEK1|A0A4R0YEK1_9PROT Uncharacterized protein OS=Roseococcus sp. SYP-B2431 OX=2496640 GN=EJV46_10485 PE=4 SV=1
YYY2 pKa = 9.47EE3 pKa = 4.47FSGSGTTIIAAEEE16 pKa = 3.86SGRR19 pKa = 11.84SCHHH23 pKa = 6.36VEEE26 pKa = 5.31SPAYYY31 pKa = 10.58DDD33 pKa = 3.58AVLRR37 pKa = 11.84WEEE40 pKa = 4.42FTGCLAVLEEE50 pKa = 4.64DDD52 pKa = 3.85ASYYY56 pKa = 10.78ATAALRR62 pKa = 11.84AEEE65 pKa = 4.53EE66 pKa = 4.36ATGAGEEE73 pKa = 4.12T
YYY2 pKa = 9.47EE3 pKa = 4.47FSGSGTTIIAAEEE16 pKa = 3.86SGRR19 pKa = 11.84SCHHH23 pKa = 6.36VEEE26 pKa = 5.31SPAYYY31 pKa = 10.58DDD33 pKa = 3.58AVLRR37 pKa = 11.84WEEE40 pKa = 4.42FTGCLAVLEEE50 pKa = 4.64DDD52 pKa = 3.85ASYYY56 pKa = 10.78ATAALRR62 pKa = 11.84AEEE65 pKa = 4.53EE66 pKa = 4.36ATGAGEEE73 pKa = 4.12T
Molecular weight: 7.54 kDa
Isoelectric point according different methods:
Protein with the highest isoelectric point:
>tr|A0A4R0YHB5|A0A4R0YHB5_9PROT Disulfide bond formation protein B OS=Roseococcus sp. SYP-B2431 OX=2496640 GN=EJV46_06325 PE=4 SV=1
MM1 pKa = 7.35KK2 pKa = 9.43RR3 pKa = 11.84TYY5 pKa = 10.27QPSKK9 pKa = 9.73LVRR12 pKa = 11.84KK13 pKa = 9.15RR14 pKa = 11.84RR15 pKa = 11.84HH16 pKa = 4.54GFRR19 pKa = 11.84ARR21 pKa = 11.84TATVGGRR28 pKa = 11.84KK29 pKa = 9.11VLANRR34 pKa = 11.84RR35 pKa = 11.84SKK37 pKa = 10.87GRR39 pKa = 11.84AKK41 pKa = 10.73LSAA44 pKa = 3.92
MM1 pKa = 7.35KK2 pKa = 9.43RR3 pKa = 11.84TYY5 pKa = 10.27QPSKK9 pKa = 9.73LVRR12 pKa = 11.84KK13 pKa = 9.15RR14 pKa = 11.84RR15 pKa = 11.84HH16 pKa = 4.54GFRR19 pKa = 11.84ARR21 pKa = 11.84TATVGGRR28 pKa = 11.84KK29 pKa = 9.11VLANRR34 pKa = 11.84RR35 pKa = 11.84SKK37 pKa = 10.87GRR39 pKa = 11.84AKK41 pKa = 10.73LSAA44 pKa = 3.92
Molecular weight: 5.05 kDa
Isoelectric point according different methods:
Peptides (in silico digests for buttom-up proteomics)
Below you can find in silico digests of the whole proteome with Trypsin, Chymotrypsin, Trypsin+LysC, LysN, ArgC proteases suitable for different mass spec machines.| Try ESI |
 |
|---|
| ChTry ESI |
|
|---|
| ArgC ESI |
|
|---|
| LysN ESI |
|
|---|
| TryLysC ESI |
|
|---|
| Try MALDI |
|
|---|
| ChTry MALDI |
|
|---|
| ArgC MALDI |
|
|---|
| LysN MALDI |
|
|---|
| TryLysC MALDI |
|
|---|
| Try LTQ |
|
|---|
| ChTry LTQ |
|
|---|
| ArgC LTQ |
|
|---|
| LysN LTQ |
|
|---|
| TryLysC LTQ |
|
|---|
| Try MSlow |
|
|---|
| ChTry MSlow |
|
|---|
| ArgC MSlow |
|
|---|
| LysN MSlow |
|
|---|
| TryLysC MSlow |
|
|---|
| Try MShigh |
|
|---|
| ChTry MShigh |
|
|---|
| ArgC MShigh |
|
|---|
| LysN MShigh |
|
|---|
| TryLysC MShigh |
|
|---|
General Statistics
Number of major isoforms |
Number of additional isoforms |
Number of all proteins |
Number of amino acids |
Min. Seq. Length |
Max. Seq. Length |
Avg. Seq. Length |
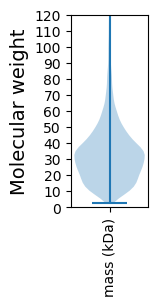
Avg. Mol. Weight |
|---|---|---|---|---|---|---|---|
0 |
1429663 |
26 |
2400 |
323.7 |
34.79 |
Amino acid frequency
Ala |
Cys |
Asp |
Glu |
Phe |
Gly |
His |
Ile |
Lys |
Leu |
|---|---|---|---|---|---|---|---|---|---|
14.435 ± 0.069 | 0.835 ± 0.01 |
4.863 ± 0.022 | 5.735 ± 0.036 |
3.398 ± 0.024 | 9.332 ± 0.037 |
2.029 ± 0.018 | 4.302 ± 0.025 |
2.107 ± 0.033 | 10.818 ± 0.044 |
Met |
Asn |
Gln |
Pro |
Arg |
Ser |
Thr |
Val |
Trp |
Tyr |
|---|---|---|---|---|---|---|---|---|---|
2.527 ± 0.016 | 2.13 ± 0.02 |
6.227 ± 0.034 | 3.001 ± 0.021 |
8.364 ± 0.041 | 4.665 ± 0.03 |
4.875 ± 0.025 | 7.149 ± 0.029 |
1.467 ± 0.017 | 1.741 ± 0.018 |
Most of the basic statistics you can see at this page can be downloaded from this CSV file
See this proteome in:

Proteome-pI is available under Creative Commons Attribution-NoDerivs license, for more details see here
| Reference: Kozlowski LP. Proteome-pI 2.0: Proteome Isoelectric Point Database Update. Nucleic Acids Res. 2021, doi: 10.1093/nar/gkab944 | Contact: Lukasz P. Kozlowski |