Lactococcus phage P087
Taxonomy: Viruses; Duplodnaviria; Heunggongvirae; Uroviricota; Caudoviricetes; Caudovirales; Siphoviridae; Teubervirus; Lactococcus virus P087
Average proteome isoelectric point is 5.82
Get precalculated fractions of proteins
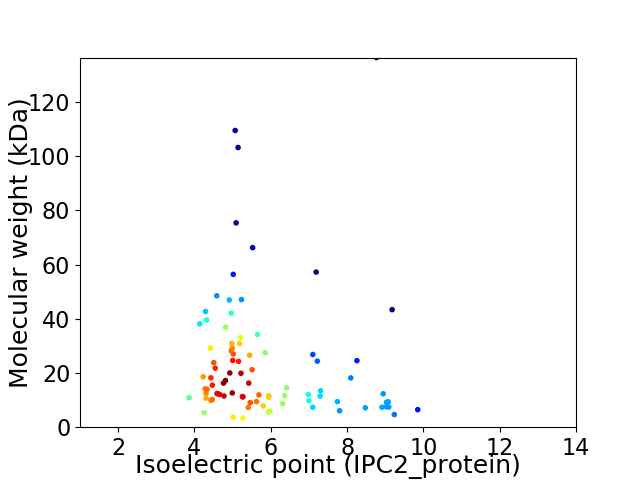
Virtual 2D-PAGE plot for 88 proteins (isoelectric point calculated using IPC2_protein)
Get csv file with sequences according to given criteria:
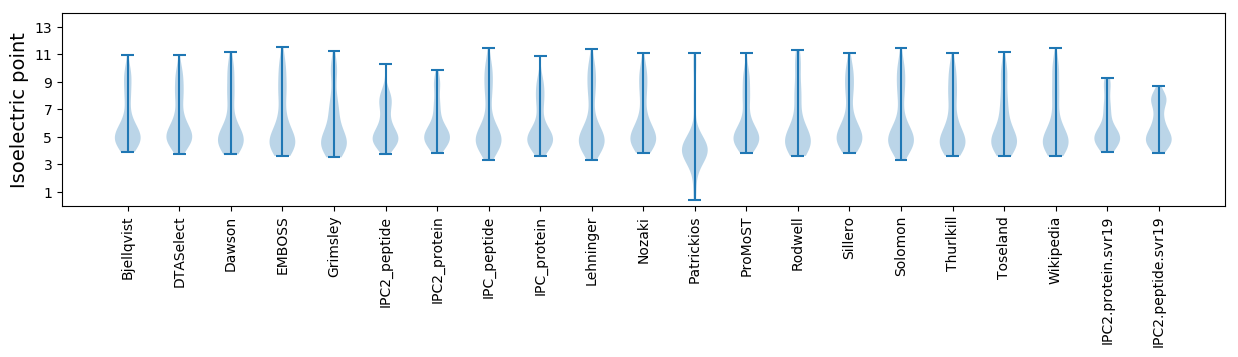
* You can choose from 21 different methods for calculating isoelectric point
Summary statistics related to proteome-wise predictions
Protein with the lowest isoelectric point:
>tr|C3U2L6|C3U2L6_9CAUD Uncharacterized protein OS=Lactococcus phage P087 OX=641487 PE=4 SV=1
MM1 pKa = 7.84IDD3 pKa = 3.35RR4 pKa = 11.84LEE6 pKa = 4.96DD7 pKa = 3.34YY8 pKa = 9.55TVAAIAFMKK17 pKa = 10.77AGDD20 pKa = 3.78QWSSFYY26 pKa = 11.34DD27 pKa = 3.39KK28 pKa = 11.32DD29 pKa = 3.42GVYY32 pKa = 10.15YY33 pKa = 10.12PSSNTVDD40 pKa = 3.94FAVAHH45 pKa = 6.54SIAA48 pKa = 3.91
MM1 pKa = 7.84IDD3 pKa = 3.35RR4 pKa = 11.84LEE6 pKa = 4.96DD7 pKa = 3.34YY8 pKa = 9.55TVAAIAFMKK17 pKa = 10.77AGDD20 pKa = 3.78QWSSFYY26 pKa = 11.34DD27 pKa = 3.39KK28 pKa = 11.32DD29 pKa = 3.42GVYY32 pKa = 10.15YY33 pKa = 10.12PSSNTVDD40 pKa = 3.94FAVAHH45 pKa = 6.54SIAA48 pKa = 3.91
Molecular weight: 5.37 kDa
Isoelectric point according different methods:
Protein with the highest isoelectric point:
>tr|C3U2N8|C3U2N8_9CAUD Uncharacterized protein OS=Lactococcus phage P087 OX=641487 PE=4 SV=1
MM1 pKa = 7.21KK2 pKa = 9.97RR3 pKa = 11.84FYY5 pKa = 10.71RR6 pKa = 11.84IFVKK10 pKa = 10.91NEE12 pKa = 3.34IIFRR16 pKa = 11.84IFTRR20 pKa = 11.84NIRR23 pKa = 11.84RR24 pKa = 11.84ILTQNKK30 pKa = 8.36PVNHH34 pKa = 7.11ACLTAKK40 pKa = 10.27IFWGNFLGIQCEE52 pKa = 4.1II53 pKa = 4.08
MM1 pKa = 7.21KK2 pKa = 9.97RR3 pKa = 11.84FYY5 pKa = 10.71RR6 pKa = 11.84IFVKK10 pKa = 10.91NEE12 pKa = 3.34IIFRR16 pKa = 11.84IFTRR20 pKa = 11.84NIRR23 pKa = 11.84RR24 pKa = 11.84ILTQNKK30 pKa = 8.36PVNHH34 pKa = 7.11ACLTAKK40 pKa = 10.27IFWGNFLGIQCEE52 pKa = 4.1II53 pKa = 4.08
Molecular weight: 6.47 kDa
Isoelectric point according different methods:
Peptides (in silico digests for buttom-up proteomics)
Below you can find in silico digests of the whole proteome with Trypsin, Chymotrypsin, Trypsin+LysC, LysN, ArgC proteases suitable for different mass spec machines.| Try ESI |
 |
|---|
| ChTry ESI |
|
|---|
| ArgC ESI |
|
|---|
| LysN ESI |
|
|---|
| TryLysC ESI |
|
|---|
| Try MALDI |
|
|---|
| ChTry MALDI |
|
|---|
| ArgC MALDI |
|
|---|
| LysN MALDI |
|
|---|
| TryLysC MALDI |
|
|---|
| Try LTQ |
|
|---|
| ChTry LTQ |
|
|---|
| ArgC LTQ |
|
|---|
| LysN LTQ |
|
|---|
| TryLysC LTQ |
|
|---|
| Try MSlow |
|
|---|
| ChTry MSlow |
|
|---|
| ArgC MSlow |
|
|---|
| LysN MSlow |
|
|---|
| TryLysC MSlow |
|
|---|
| Try MShigh |
|
|---|
| ChTry MShigh |
|
|---|
| ArgC MShigh |
|
|---|
| LysN MShigh |
|
|---|
| TryLysC MShigh |
|
|---|
General Statistics
Number of major isoforms |
Number of additional isoforms |
Number of all proteins |
Number of amino acids |
Min. Seq. Length |
Max. Seq. Length |
Avg. Seq. Length |
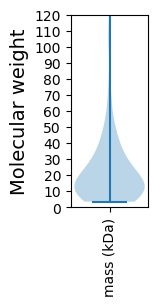
Avg. Mol. Weight |
|---|---|---|---|---|---|---|---|
0 |
18361 |
29 |
1309 |
208.6 |
23.55 |
Amino acid frequency
Ala |
Cys |
Asp |
Glu |
Phe |
Gly |
His |
Ile |
Lys |
Leu |
|---|---|---|---|---|---|---|---|---|---|
6.051 ± 0.426 | 1.116 ± 0.174 |
6.47 ± 0.196 | 6.819 ± 0.442 |
4.058 ± 0.191 | 6.154 ± 0.46 |
1.59 ± 0.143 | 6.868 ± 0.218 |
7.037 ± 0.277 | 8.687 ± 0.254 |
Met |
Asn |
Gln |
Pro |
Arg |
Ser |
Thr |
Val |
Trp |
Tyr |
|---|---|---|---|---|---|---|---|---|---|
2.794 ± 0.123 | 6.291 ± 0.232 |
3.284 ± 0.185 | 3.916 ± 0.203 |
3.6 ± 0.205 | 6.307 ± 0.311 |
7.031 ± 0.285 | 6.579 ± 0.238 |
1.138 ± 0.1 | 4.21 ± 0.246 |
Most of the basic statistics you can see at this page can be downloaded from this CSV file
See this proteome in:

Proteome-pI is available under Creative Commons Attribution-NoDerivs license, for more details see here
| Reference: Kozlowski LP. Proteome-pI 2.0: Proteome Isoelectric Point Database Update. Nucleic Acids Res. 2021, doi: 10.1093/nar/gkab944 | Contact: Lukasz P. Kozlowski |