Pseudoalteromonas phage PH1
Taxonomy: Viruses; Duplodnaviria; Heunggongvirae; Uroviricota; Caudoviricetes; Caudovirales; Podoviridae; Kafunavirus; unclassified Kafunavirus
Average proteome isoelectric point is 6.03
Get precalculated fractions of proteins
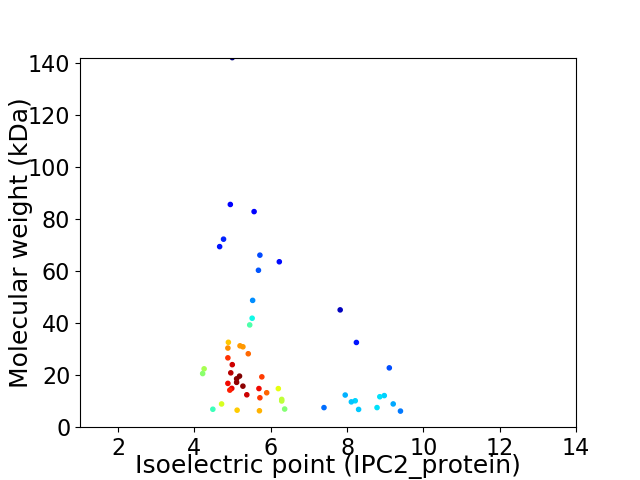
Virtual 2D-PAGE plot for 54 proteins (isoelectric point calculated using IPC2_protein)
Get csv file with sequences according to given criteria:
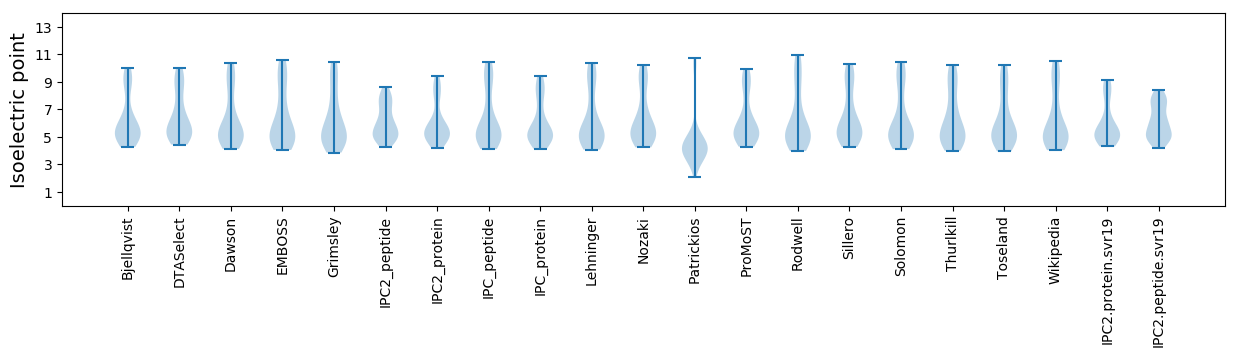
* You can choose from 21 different methods for calculating isoelectric point
Summary statistics related to proteome-wise predictions
Protein with the lowest isoelectric point:
>tr|A0A1B2AP81|A0A1B2AP81_9CAUD Uncharacterized protein OS=Pseudoalteromonas phage PH1 OX=1874540 PE=4 SV=1
MM1 pKa = 7.68KK2 pKa = 7.8EE3 pKa = 4.06TNIVLCKK10 pKa = 10.45CNEE13 pKa = 3.95DD14 pKa = 3.48VFLEE18 pKa = 4.46LVQSEE23 pKa = 4.59QVFGHH28 pKa = 6.6PDD30 pKa = 3.33EE31 pKa = 4.95FVMHH35 pKa = 6.84IADD38 pKa = 4.35FCSLSDD44 pKa = 3.95DD45 pKa = 3.37MKK47 pKa = 11.41EE48 pKa = 4.28EE49 pKa = 4.05IEE51 pKa = 5.07HH52 pKa = 6.31EE53 pKa = 4.24YY54 pKa = 10.68LYY56 pKa = 11.27KK57 pKa = 10.52KK58 pKa = 10.63
MM1 pKa = 7.68KK2 pKa = 7.8EE3 pKa = 4.06TNIVLCKK10 pKa = 10.45CNEE13 pKa = 3.95DD14 pKa = 3.48VFLEE18 pKa = 4.46LVQSEE23 pKa = 4.59QVFGHH28 pKa = 6.6PDD30 pKa = 3.33EE31 pKa = 4.95FVMHH35 pKa = 6.84IADD38 pKa = 4.35FCSLSDD44 pKa = 3.95DD45 pKa = 3.37MKK47 pKa = 11.41EE48 pKa = 4.28EE49 pKa = 4.05IEE51 pKa = 5.07HH52 pKa = 6.31EE53 pKa = 4.24YY54 pKa = 10.68LYY56 pKa = 11.27KK57 pKa = 10.52KK58 pKa = 10.63
Molecular weight: 6.9 kDa
Isoelectric point according different methods:
Protein with the highest isoelectric point:
>tr|A0A1B2ANN0|A0A1B2ANN0_9CAUD Uncharacterized protein OS=Pseudoalteromonas phage PH1 OX=1874540 PE=4 SV=1
MM1 pKa = 8.01RR2 pKa = 11.84DD3 pKa = 3.29LVVIGLRR10 pKa = 11.84SASRR14 pKa = 11.84EE15 pKa = 3.99EE16 pKa = 4.11IKK18 pKa = 10.97ALTIEE23 pKa = 4.36WQTKK27 pKa = 9.37GYY29 pKa = 9.17IVKK32 pKa = 10.18HH33 pKa = 4.91KK34 pKa = 10.34RR35 pKa = 11.84FYY37 pKa = 11.08KK38 pKa = 10.52SGLPLPNNGVLQCTTKK54 pKa = 10.92
MM1 pKa = 8.01RR2 pKa = 11.84DD3 pKa = 3.29LVVIGLRR10 pKa = 11.84SASRR14 pKa = 11.84EE15 pKa = 3.99EE16 pKa = 4.11IKK18 pKa = 10.97ALTIEE23 pKa = 4.36WQTKK27 pKa = 9.37GYY29 pKa = 9.17IVKK32 pKa = 10.18HH33 pKa = 4.91KK34 pKa = 10.34RR35 pKa = 11.84FYY37 pKa = 11.08KK38 pKa = 10.52SGLPLPNNGVLQCTTKK54 pKa = 10.92
Molecular weight: 6.19 kDa
Isoelectric point according different methods:
Peptides (in silico digests for buttom-up proteomics)
Below you can find in silico digests of the whole proteome with Trypsin, Chymotrypsin, Trypsin+LysC, LysN, ArgC proteases suitable for different mass spec machines.| Try ESI |
 |
|---|
| ChTry ESI |
|
|---|
| ArgC ESI |
|
|---|
| LysN ESI |
|
|---|
| TryLysC ESI |
|
|---|
| Try MALDI |
|
|---|
| ChTry MALDI |
|
|---|
| ArgC MALDI |
|
|---|
| LysN MALDI |
|
|---|
| TryLysC MALDI |
|
|---|
| Try LTQ |
|
|---|
| ChTry LTQ |
|
|---|
| ArgC LTQ |
|
|---|
| LysN LTQ |
|
|---|
| TryLysC LTQ |
|
|---|
| Try MSlow |
|
|---|
| ChTry MSlow |
|
|---|
| ArgC MSlow |
|
|---|
| LysN MSlow |
|
|---|
| TryLysC MSlow |
|
|---|
| Try MShigh |
|
|---|
| ChTry MShigh |
|
|---|
| ArgC MShigh |
|
|---|
| LysN MShigh |
|
|---|
| TryLysC MShigh |
|
|---|
General Statistics
Number of major isoforms |
Number of additional isoforms |
Number of all proteins |
Number of amino acids |
Min. Seq. Length |
Max. Seq. Length |
Avg. Seq. Length |
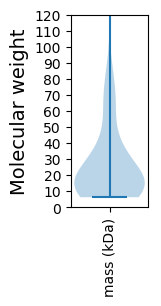
Avg. Mol. Weight |
|---|---|---|---|---|---|---|---|
0 |
13294 |
54 |
1299 |
246.2 |
27.65 |
Amino acid frequency
Ala |
Cys |
Asp |
Glu |
Phe |
Gly |
His |
Ile |
Lys |
Leu |
|---|---|---|---|---|---|---|---|---|---|
8.252 ± 0.508 | 0.978 ± 0.146 |
6.289 ± 0.161 | 7.274 ± 0.235 |
3.799 ± 0.2 | 6.454 ± 0.284 |
1.843 ± 0.166 | 5.363 ± 0.193 |
6.762 ± 0.304 | 8.598 ± 0.295 |
Met |
Asn |
Gln |
Pro |
Arg |
Ser |
Thr |
Val |
Trp |
Tyr |
|---|---|---|---|---|---|---|---|---|---|
2.655 ± 0.168 | 4.98 ± 0.155 |
3.423 ± 0.178 | 4.1 ± 0.321 |
4.619 ± 0.266 | 6.386 ± 0.387 |
6.356 ± 0.254 | 6.499 ± 0.256 |
1.309 ± 0.124 | 4.062 ± 0.168 |
Most of the basic statistics you can see at this page can be downloaded from this CSV file
See this proteome in:

Proteome-pI is available under Creative Commons Attribution-NoDerivs license, for more details see here
| Reference: Kozlowski LP. Proteome-pI 2.0: Proteome Isoelectric Point Database Update. Nucleic Acids Res. 2021, doi: 10.1093/nar/gkab944 | Contact: Lukasz P. Kozlowski |