Ulvibacter antarcticus
Taxonomy: cellular organisms; Bacteria; FCB group; Bacteroidetes/Chlorobi group; Bacteroidetes; Flavobacteriia; Flavobacteriales; Flavobacteriaceae; Ulvibacter
Average proteome isoelectric point is 6.3
Get precalculated fractions of proteins
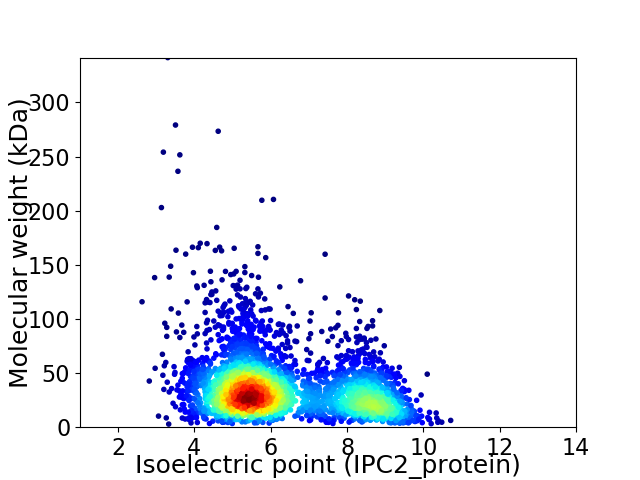
Virtual 2D-PAGE plot for 3363 proteins (isoelectric point calculated using IPC2_protein)
Get csv file with sequences according to given criteria:
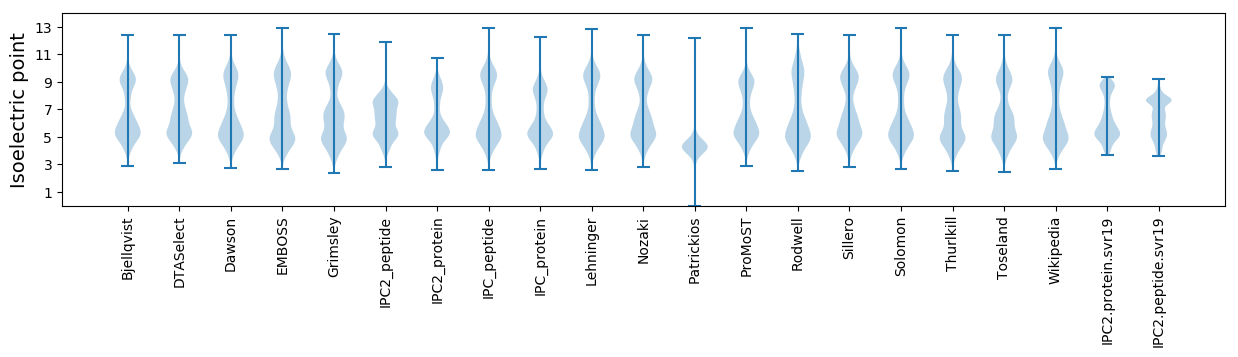
* You can choose from 21 different methods for calculating isoelectric point
Summary statistics related to proteome-wise predictions
Protein with the lowest isoelectric point:
>tr|A0A3L9YW39|A0A3L9YW39_9FLAO Uncharacterized protein OS=Ulvibacter antarcticus OX=442714 GN=BXY75_2057 PE=4 SV=1
MM1 pKa = 7.49KK2 pKa = 10.72NSILCAAALLIGTAGIAQLNIANIVQTGLNNNSNNVQNGVYY43 pKa = 10.58NEE45 pKa = 4.0IKK47 pKa = 10.5VIQNGNSNNSLIAQNGTNNFSCVEE71 pKa = 3.86QDD73 pKa = 3.29GDD75 pKa = 3.62WNYY78 pKa = 11.17SEE80 pKa = 5.35VDD82 pKa = 2.92QTGNYY87 pKa = 8.71NSNVGLQQGDD97 pKa = 4.31LNFSDD102 pKa = 4.38VDD104 pKa = 3.74QDD106 pKa = 3.79GDD108 pKa = 3.85NNNADD113 pKa = 3.99FDD115 pKa = 4.11QLGNQNANAQNQLGDD130 pKa = 3.89NNDD133 pKa = 3.44SQVYY137 pKa = 10.7SDD139 pKa = 4.0GNMNATATDD148 pKa = 3.45QQGDD152 pKa = 4.01SNSAFVYY159 pKa = 10.39QDD161 pKa = 3.03GNQNVGDD168 pKa = 4.03IAQSGDD174 pKa = 3.47SNLGYY179 pKa = 10.13IYY181 pKa = 10.35QDD183 pKa = 3.24GNKK186 pKa = 9.91NSGDD190 pKa = 3.57IEE192 pKa = 4.18QSGDD196 pKa = 3.41SNQAEE201 pKa = 3.81ILQFGNRR208 pKa = 11.84NASAVTQTGDD218 pKa = 2.98ANFAVTIQTDD228 pKa = 3.14RR229 pKa = 11.84RR230 pKa = 11.84NVSNVEE236 pKa = 3.7QTGDD240 pKa = 3.37GNFAFVQQDD249 pKa = 2.98GRR251 pKa = 11.84RR252 pKa = 11.84NSSDD256 pKa = 2.83INQTGDD262 pKa = 3.24GNYY265 pKa = 9.0STVSQTGRR273 pKa = 11.84KK274 pKa = 7.92NVNYY278 pKa = 10.31NSQQGNYY285 pKa = 9.05NSNDD289 pKa = 2.45ITQIGRR295 pKa = 11.84RR296 pKa = 11.84NDD298 pKa = 3.32SYY300 pKa = 11.79VLQLGDD306 pKa = 3.67YY307 pKa = 9.82NKK309 pKa = 9.03NTTVQDD315 pKa = 4.66GINNDD320 pKa = 3.03SDD322 pKa = 4.15VYY324 pKa = 11.09QIGDD328 pKa = 3.96GNCSDD333 pKa = 4.51VFQDD337 pKa = 3.45GNNNVGLTVQVGNNHH352 pKa = 6.81IANIHH357 pKa = 4.18QTGNGNNATIGQLGGTPFNTTITQTGGGNLTKK389 pKa = 10.17INQNGSFF396 pKa = 3.6
MM1 pKa = 7.49KK2 pKa = 10.72NSILCAAALLIGTAGIAQLNIANIVQTGLNNNSNNVQNGVYY43 pKa = 10.58NEE45 pKa = 4.0IKK47 pKa = 10.5VIQNGNSNNSLIAQNGTNNFSCVEE71 pKa = 3.86QDD73 pKa = 3.29GDD75 pKa = 3.62WNYY78 pKa = 11.17SEE80 pKa = 5.35VDD82 pKa = 2.92QTGNYY87 pKa = 8.71NSNVGLQQGDD97 pKa = 4.31LNFSDD102 pKa = 4.38VDD104 pKa = 3.74QDD106 pKa = 3.79GDD108 pKa = 3.85NNNADD113 pKa = 3.99FDD115 pKa = 4.11QLGNQNANAQNQLGDD130 pKa = 3.89NNDD133 pKa = 3.44SQVYY137 pKa = 10.7SDD139 pKa = 4.0GNMNATATDD148 pKa = 3.45QQGDD152 pKa = 4.01SNSAFVYY159 pKa = 10.39QDD161 pKa = 3.03GNQNVGDD168 pKa = 4.03IAQSGDD174 pKa = 3.47SNLGYY179 pKa = 10.13IYY181 pKa = 10.35QDD183 pKa = 3.24GNKK186 pKa = 9.91NSGDD190 pKa = 3.57IEE192 pKa = 4.18QSGDD196 pKa = 3.41SNQAEE201 pKa = 3.81ILQFGNRR208 pKa = 11.84NASAVTQTGDD218 pKa = 2.98ANFAVTIQTDD228 pKa = 3.14RR229 pKa = 11.84RR230 pKa = 11.84NVSNVEE236 pKa = 3.7QTGDD240 pKa = 3.37GNFAFVQQDD249 pKa = 2.98GRR251 pKa = 11.84RR252 pKa = 11.84NSSDD256 pKa = 2.83INQTGDD262 pKa = 3.24GNYY265 pKa = 9.0STVSQTGRR273 pKa = 11.84KK274 pKa = 7.92NVNYY278 pKa = 10.31NSQQGNYY285 pKa = 9.05NSNDD289 pKa = 2.45ITQIGRR295 pKa = 11.84RR296 pKa = 11.84NDD298 pKa = 3.32SYY300 pKa = 11.79VLQLGDD306 pKa = 3.67YY307 pKa = 9.82NKK309 pKa = 9.03NTTVQDD315 pKa = 4.66GINNDD320 pKa = 3.03SDD322 pKa = 4.15VYY324 pKa = 11.09QIGDD328 pKa = 3.96GNCSDD333 pKa = 4.51VFQDD337 pKa = 3.45GNNNVGLTVQVGNNHH352 pKa = 6.81IANIHH357 pKa = 4.18QTGNGNNATIGQLGGTPFNTTITQTGGGNLTKK389 pKa = 10.17INQNGSFF396 pKa = 3.6
Molecular weight: 42.24 kDa
Isoelectric point according different methods:
Protein with the highest isoelectric point:
>tr|A0A3L9YVR7|A0A3L9YVR7_9FLAO YHYH protein OS=Ulvibacter antarcticus OX=442714 GN=BXY75_1647 PE=4 SV=1
MM1 pKa = 7.69SKK3 pKa = 9.01RR4 pKa = 11.84TFQPSKK10 pKa = 9.13RR11 pKa = 11.84KK12 pKa = 9.48RR13 pKa = 11.84RR14 pKa = 11.84NKK16 pKa = 9.49HH17 pKa = 3.94GFRR20 pKa = 11.84EE21 pKa = 4.18RR22 pKa = 11.84MASVNGRR29 pKa = 11.84KK30 pKa = 9.17VLAARR35 pKa = 11.84RR36 pKa = 11.84AKK38 pKa = 9.87GRR40 pKa = 11.84KK41 pKa = 8.56KK42 pKa = 10.21ISVSSEE48 pKa = 3.74TRR50 pKa = 11.84HH51 pKa = 5.96KK52 pKa = 10.68KK53 pKa = 9.8
MM1 pKa = 7.69SKK3 pKa = 9.01RR4 pKa = 11.84TFQPSKK10 pKa = 9.13RR11 pKa = 11.84KK12 pKa = 9.48RR13 pKa = 11.84RR14 pKa = 11.84NKK16 pKa = 9.49HH17 pKa = 3.94GFRR20 pKa = 11.84EE21 pKa = 4.18RR22 pKa = 11.84MASVNGRR29 pKa = 11.84KK30 pKa = 9.17VLAARR35 pKa = 11.84RR36 pKa = 11.84AKK38 pKa = 9.87GRR40 pKa = 11.84KK41 pKa = 8.56KK42 pKa = 10.21ISVSSEE48 pKa = 3.74TRR50 pKa = 11.84HH51 pKa = 5.96KK52 pKa = 10.68KK53 pKa = 9.8
Molecular weight: 6.26 kDa
Isoelectric point according different methods:
Peptides (in silico digests for buttom-up proteomics)
Below you can find in silico digests of the whole proteome with Trypsin, Chymotrypsin, Trypsin+LysC, LysN, ArgC proteases suitable for different mass spec machines.| Try ESI |
 |
|---|
| ChTry ESI |
|
|---|
| ArgC ESI |
|
|---|
| LysN ESI |
|
|---|
| TryLysC ESI |
|
|---|
| Try MALDI |
|
|---|
| ChTry MALDI |
|
|---|
| ArgC MALDI |
|
|---|
| LysN MALDI |
|
|---|
| TryLysC MALDI |
|
|---|
| Try LTQ |
|
|---|
| ChTry LTQ |
|
|---|
| ArgC LTQ |
|
|---|
| LysN LTQ |
|
|---|
| TryLysC LTQ |
|
|---|
| Try MSlow |
|
|---|
| ChTry MSlow |
|
|---|
| ArgC MSlow |
|
|---|
| LysN MSlow |
|
|---|
| TryLysC MSlow |
|
|---|
| Try MShigh |
|
|---|
| ChTry MShigh |
|
|---|
| ArgC MShigh |
|
|---|
| LysN MShigh |
|
|---|
| TryLysC MShigh |
|
|---|
General Statistics
Number of major isoforms |
Number of additional isoforms |
Number of all proteins |
Number of amino acids |
Min. Seq. Length |
Max. Seq. Length |
Avg. Seq. Length |
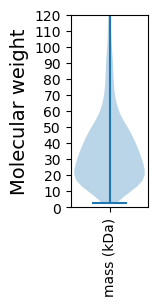
Avg. Mol. Weight |
|---|---|---|---|---|---|---|---|
0 |
1143827 |
25 |
3224 |
340.1 |
38.18 |
Amino acid frequency
Ala |
Cys |
Asp |
Glu |
Phe |
Gly |
His |
Ile |
Lys |
Leu |
|---|---|---|---|---|---|---|---|---|---|
6.506 ± 0.04 | 0.774 ± 0.015 |
5.715 ± 0.035 | 6.66 ± 0.042 |
5.15 ± 0.033 | 6.676 ± 0.054 |
1.694 ± 0.023 | 7.93 ± 0.04 |
7.243 ± 0.057 | 9.238 ± 0.04 |
Met |
Asn |
Gln |
Pro |
Arg |
Ser |
Thr |
Val |
Trp |
Tyr |
|---|---|---|---|---|---|---|---|---|---|
2.254 ± 0.025 | 6.09 ± 0.051 |
3.391 ± 0.027 | 3.234 ± 0.027 |
3.415 ± 0.027 | 6.839 ± 0.034 |
5.977 ± 0.046 | 6.293 ± 0.037 |
0.994 ± 0.014 | 3.926 ± 0.031 |
Most of the basic statistics you can see at this page can be downloaded from this CSV file
See this proteome in:

Proteome-pI is available under Creative Commons Attribution-NoDerivs license, for more details see here
| Reference: Kozlowski LP. Proteome-pI 2.0: Proteome Isoelectric Point Database Update. Nucleic Acids Res. 2021, doi: 10.1093/nar/gkab944 | Contact: Lukasz P. Kozlowski |