Micrococcus endophyticus
Taxonomy: cellular organisms; Bacteria; Terrabacteria group; Actinobacteria; Actinomycetia; Micrococcales; Micrococcaceae; Micrococcus
Average proteome isoelectric point is 6.13
Get precalculated fractions of proteins
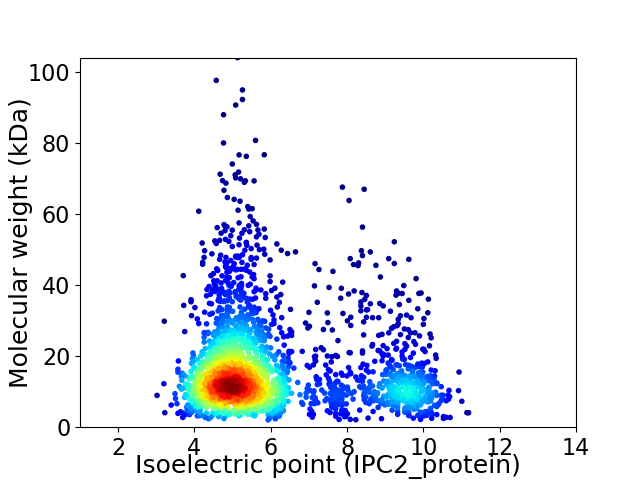
Virtual 2D-PAGE plot for 2319 proteins (isoelectric point calculated using IPC2_protein)
Get csv file with sequences according to given criteria:
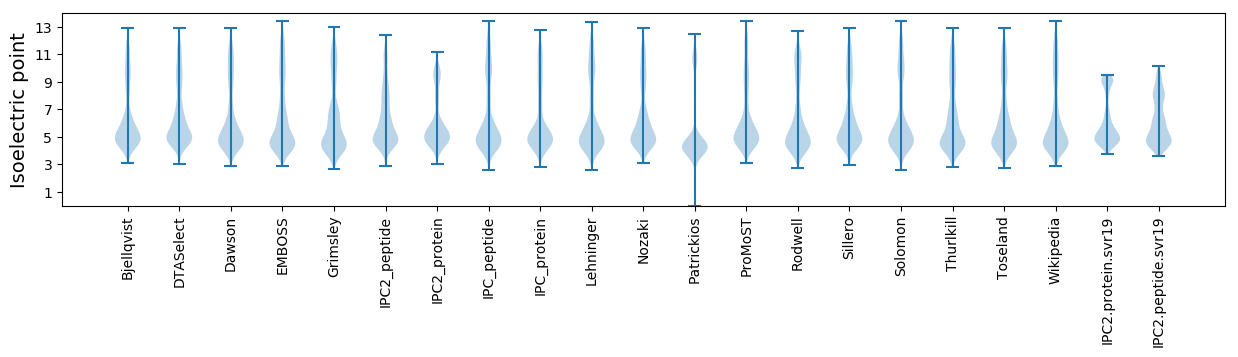
* You can choose from 21 different methods for calculating isoelectric point
Summary statistics related to proteome-wise predictions
Protein with the lowest isoelectric point:
>tr|A0A4Y8XRW7|A0A4Y8XRW7_9MICC ATP-binding cassette domain-containing protein (Fragment) OS=Micrococcus endophyticus OX=455343 GN=E4A41_14735 PE=4 SV=1
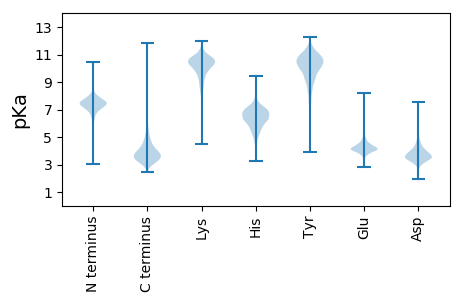
AA1 pKa = 7.32GAIAACEE8 pKa = 4.22CEE10 pKa = 4.8AGCPSCVQSPKK21 pKa = 10.18CGNRR25 pKa = 11.84NSPLDD30 pKa = 3.41KK31 pKa = 11.13AGALTVLRR39 pKa = 11.84FLLGQADD46 pKa = 3.79HH47 pKa = 6.69LVPVVAEE54 pKa = 4.56GSGEE58 pKa = 4.19TDD60 pKa = 2.67GGTDD64 pKa = 3.8DD65 pKa = 4.95GVGVDD70 pKa = 5.68DD71 pKa = 5.09EE72 pKa = 4.84DD73 pKa = 5.42ASGSGSSGTAA83 pKa = 2.89
AA1 pKa = 7.32GAIAACEE8 pKa = 4.22CEE10 pKa = 4.8AGCPSCVQSPKK21 pKa = 10.18CGNRR25 pKa = 11.84NSPLDD30 pKa = 3.41KK31 pKa = 11.13AGALTVLRR39 pKa = 11.84FLLGQADD46 pKa = 3.79HH47 pKa = 6.69LVPVVAEE54 pKa = 4.56GSGEE58 pKa = 4.19TDD60 pKa = 2.67GGTDD64 pKa = 3.8DD65 pKa = 4.95GVGVDD70 pKa = 5.68DD71 pKa = 5.09EE72 pKa = 4.84DD73 pKa = 5.42ASGSGSSGTAA83 pKa = 2.89
Molecular weight: 7.99 kDa
Isoelectric point according different methods:
Protein with the highest isoelectric point:
>tr|A0A4Y8ZDD0|A0A4Y8ZDD0_9MICC Dihydroorotase (Fragment) OS=Micrococcus endophyticus OX=455343 GN=E4A41_07490 PE=4 SV=1
MM1 pKa = 7.51TKK3 pKa = 9.09RR4 pKa = 11.84TFQPNNRR11 pKa = 11.84RR12 pKa = 11.84RR13 pKa = 11.84ARR15 pKa = 11.84KK16 pKa = 8.24HH17 pKa = 4.59GFRR20 pKa = 11.84ARR22 pKa = 11.84MRR24 pKa = 11.84TRR26 pKa = 11.84AGRR29 pKa = 11.84AILAAA34 pKa = 4.46
MM1 pKa = 7.51TKK3 pKa = 9.09RR4 pKa = 11.84TFQPNNRR11 pKa = 11.84RR12 pKa = 11.84RR13 pKa = 11.84ARR15 pKa = 11.84KK16 pKa = 8.24HH17 pKa = 4.59GFRR20 pKa = 11.84ARR22 pKa = 11.84MRR24 pKa = 11.84TRR26 pKa = 11.84AGRR29 pKa = 11.84AILAAA34 pKa = 4.46
Molecular weight: 4.05 kDa
Isoelectric point according different methods:
Peptides (in silico digests for buttom-up proteomics)
Below you can find in silico digests of the whole proteome with Trypsin, Chymotrypsin, Trypsin+LysC, LysN, ArgC proteases suitable for different mass spec machines.| Try ESI |
 |
|---|
| ChTry ESI |
|
|---|
| ArgC ESI |
|
|---|
| LysN ESI |
|
|---|
| TryLysC ESI |
|
|---|
| Try MALDI |
|
|---|
| ChTry MALDI |
|
|---|
| ArgC MALDI |
|
|---|
| LysN MALDI |
|
|---|
| TryLysC MALDI |
|
|---|
| Try LTQ |
|
|---|
| ChTry LTQ |
|
|---|
| ArgC LTQ |
|
|---|
| LysN LTQ |
|
|---|
| TryLysC LTQ |
|
|---|
| Try MSlow |
|
|---|
| ChTry MSlow |
|
|---|
| ArgC MSlow |
|
|---|
| LysN MSlow |
|
|---|
| TryLysC MSlow |
|
|---|
| Try MShigh |
|
|---|
| ChTry MShigh |
|
|---|
| ArgC MShigh |
|
|---|
| LysN MShigh |
|
|---|
| TryLysC MShigh |
|
|---|
General Statistics
Number of major isoforms |
Number of additional isoforms |
Number of all proteins |
Number of amino acids |
Min. Seq. Length |
Max. Seq. Length |
Avg. Seq. Length |
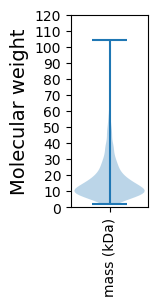
Avg. Mol. Weight |
|---|---|---|---|---|---|---|---|
0 |
377349 |
21 |
930 |
162.7 |
17.57 |
Amino acid frequency
Ala |
Cys |
Asp |
Glu |
Phe |
Gly |
His |
Ile |
Lys |
Leu |
|---|---|---|---|---|---|---|---|---|---|
12.701 ± 0.081 | 0.59 ± 0.015 |
6.081 ± 0.051 | 6.397 ± 0.065 |
3.127 ± 0.041 | 8.873 ± 0.057 |
2.342 ± 0.033 | 3.758 ± 0.041 |
2.171 ± 0.044 | 10.183 ± 0.072 |
Met |
Asn |
Gln |
Pro |
Arg |
Ser |
Thr |
Val |
Trp |
Tyr |
|---|---|---|---|---|---|---|---|---|---|
2.21 ± 0.028 | 1.877 ± 0.031 |
5.274 ± 0.046 | 3.017 ± 0.037 |
7.527 ± 0.062 | 5.06 ± 0.04 |
6.05 ± 0.047 | 9.247 ± 0.07 |
1.523 ± 0.028 | 1.994 ± 0.03 |
Most of the basic statistics you can see at this page can be downloaded from this CSV file
See this proteome in:

Proteome-pI is available under Creative Commons Attribution-NoDerivs license, for more details see here
| Reference: Kozlowski LP. Proteome-pI 2.0: Proteome Isoelectric Point Database Update. Nucleic Acids Res. 2021, doi: 10.1093/nar/gkab944 | Contact: Lukasz P. Kozlowski |