Clostridium phage phiCD6356
Taxonomy: Viruses; Duplodnaviria; Heunggongvirae; Uroviricota; Caudoviricetes; Caudovirales; Siphoviridae; unclassified Siphoviridae
Average proteome isoelectric point is 6.28
Get precalculated fractions of proteins
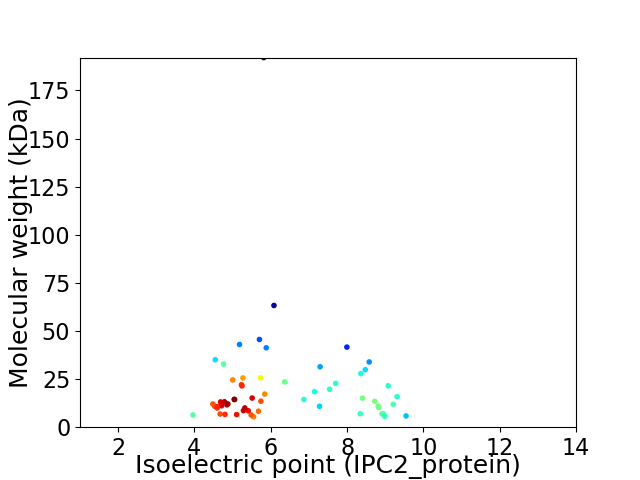
Virtual 2D-PAGE plot for 59 proteins (isoelectric point calculated using IPC2_protein)
Get csv file with sequences according to given criteria:
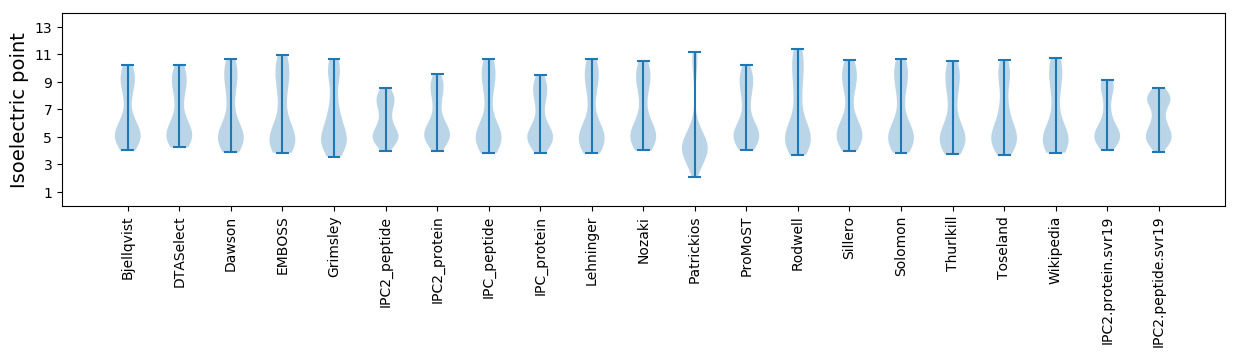
* You can choose from 21 different methods for calculating isoelectric point
Summary statistics related to proteome-wise predictions
Protein with the lowest isoelectric point:
>tr|E2ELJ4|E2ELJ4_9CAUD Uncharacterized protein OS=Clostridium phage phiCD6356 OX=864178 GN=phiCD6356_14 PE=4 SV=1
MM1 pKa = 7.71FLFEE5 pKa = 5.52KK6 pKa = 9.32NWSMTDD12 pKa = 3.09IDD14 pKa = 4.43NMDD17 pKa = 2.93IFYY20 pKa = 10.94YY21 pKa = 10.83LDD23 pKa = 2.95ILVYY27 pKa = 10.0MKK29 pKa = 10.55EE30 pKa = 4.03NKK32 pKa = 9.46KK33 pKa = 10.92DD34 pKa = 3.73NNNPNEE40 pKa = 3.87NDD42 pKa = 3.49VYY44 pKa = 10.71IDD46 pKa = 3.65QISWLL51 pKa = 3.87
MM1 pKa = 7.71FLFEE5 pKa = 5.52KK6 pKa = 9.32NWSMTDD12 pKa = 3.09IDD14 pKa = 4.43NMDD17 pKa = 2.93IFYY20 pKa = 10.94YY21 pKa = 10.83LDD23 pKa = 2.95ILVYY27 pKa = 10.0MKK29 pKa = 10.55EE30 pKa = 4.03NKK32 pKa = 9.46KK33 pKa = 10.92DD34 pKa = 3.73NNNPNEE40 pKa = 3.87NDD42 pKa = 3.49VYY44 pKa = 10.71IDD46 pKa = 3.65QISWLL51 pKa = 3.87
Molecular weight: 6.35 kDa
Isoelectric point according different methods:
Protein with the highest isoelectric point:
>tr|E2ELL5|E2ELL5_9CAUD Helix-turn-helix domain protein OS=Clostridium phage phiCD6356 OX=864178 GN=phiCD6356_35 PE=4 SV=1
MM1 pKa = 8.26DD2 pKa = 4.88NFLLNILAGVIASLIFYY19 pKa = 9.98IISKK23 pKa = 9.74LFRR26 pKa = 11.84QVKK29 pKa = 8.87NHH31 pKa = 5.97SAQKK35 pKa = 10.51SGWEE39 pKa = 3.7FDD41 pKa = 4.05LKK43 pKa = 10.85IKK45 pKa = 10.36FKK47 pKa = 10.76KK48 pKa = 10.25SRR50 pKa = 3.35
MM1 pKa = 8.26DD2 pKa = 4.88NFLLNILAGVIASLIFYY19 pKa = 9.98IISKK23 pKa = 9.74LFRR26 pKa = 11.84QVKK29 pKa = 8.87NHH31 pKa = 5.97SAQKK35 pKa = 10.51SGWEE39 pKa = 3.7FDD41 pKa = 4.05LKK43 pKa = 10.85IKK45 pKa = 10.36FKK47 pKa = 10.76KK48 pKa = 10.25SRR50 pKa = 3.35
Molecular weight: 5.86 kDa
Isoelectric point according different methods:
Peptides (in silico digests for buttom-up proteomics)
Below you can find in silico digests of the whole proteome with Trypsin, Chymotrypsin, Trypsin+LysC, LysN, ArgC proteases suitable for different mass spec machines.| Try ESI |
 |
|---|
| ChTry ESI |
|
|---|
| ArgC ESI |
|
|---|
| LysN ESI |
|
|---|
| TryLysC ESI |
|
|---|
| Try MALDI |
|
|---|
| ChTry MALDI |
|
|---|
| ArgC MALDI |
|
|---|
| LysN MALDI |
|
|---|
| TryLysC MALDI |
|
|---|
| Try LTQ |
|
|---|
| ChTry LTQ |
|
|---|
| ArgC LTQ |
|
|---|
| LysN LTQ |
|
|---|
| TryLysC LTQ |
|
|---|
| Try MSlow |
|
|---|
| ChTry MSlow |
|
|---|
| ArgC MSlow |
|
|---|
| LysN MSlow |
|
|---|
| TryLysC MSlow |
|
|---|
| Try MShigh |
|
|---|
| ChTry MShigh |
|
|---|
| ArgC MShigh |
|
|---|
| LysN MShigh |
|
|---|
| TryLysC MShigh |
|
|---|
General Statistics
Number of major isoforms |
Number of additional isoforms |
Number of all proteins |
Number of amino acids |
Min. Seq. Length |
Max. Seq. Length |
Avg. Seq. Length |
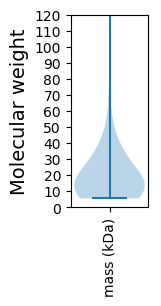
Avg. Mol. Weight |
|---|---|---|---|---|---|---|---|
0 |
10709 |
44 |
1733 |
181.5 |
20.87 |
Amino acid frequency
Ala |
Cys |
Asp |
Glu |
Phe |
Gly |
His |
Ile |
Lys |
Leu |
|---|---|---|---|---|---|---|---|---|---|
5.416 ± 0.861 | 1.149 ± 0.234 |
5.78 ± 0.353 | 9.721 ± 0.459 |
4.09 ± 0.369 | 4.846 ± 0.249 |
0.962 ± 0.17 | 8.806 ± 0.441 |
11.635 ± 0.486 | 8.404 ± 0.248 |
Met |
Asn |
Gln |
Pro |
Arg |
Ser |
Thr |
Val |
Trp |
Tyr |
|---|---|---|---|---|---|---|---|---|---|
2.4 ± 0.17 | 7.256 ± 0.371 |
1.578 ± 0.18 | 2.549 ± 0.338 |
3.306 ± 0.221 | 6.107 ± 0.469 |
5.5 ± 0.335 | 5.435 ± 0.218 |
0.943 ± 0.116 | 4.118 ± 0.507 |
Most of the basic statistics you can see at this page can be downloaded from this CSV file
See this proteome in:

Proteome-pI is available under Creative Commons Attribution-NoDerivs license, for more details see here
| Reference: Kozlowski LP. Proteome-pI 2.0: Proteome Isoelectric Point Database Update. Nucleic Acids Res. 2021, doi: 10.1093/nar/gkab944 | Contact: Lukasz P. Kozlowski |