Actinomyces phage xhp1
Taxonomy: Viruses; Duplodnaviria; Heunggongvirae; Uroviricota; Caudoviricetes; Caudovirales; Siphoviridae; unclassified Siphoviridae
Average proteome isoelectric point is 6.2
Get precalculated fractions of proteins
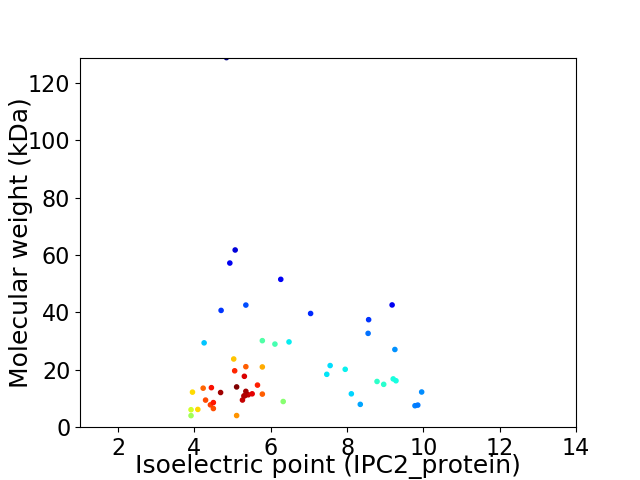
Virtual 2D-PAGE plot for 54 proteins (isoelectric point calculated using IPC2_protein)
Get csv file with sequences according to given criteria:
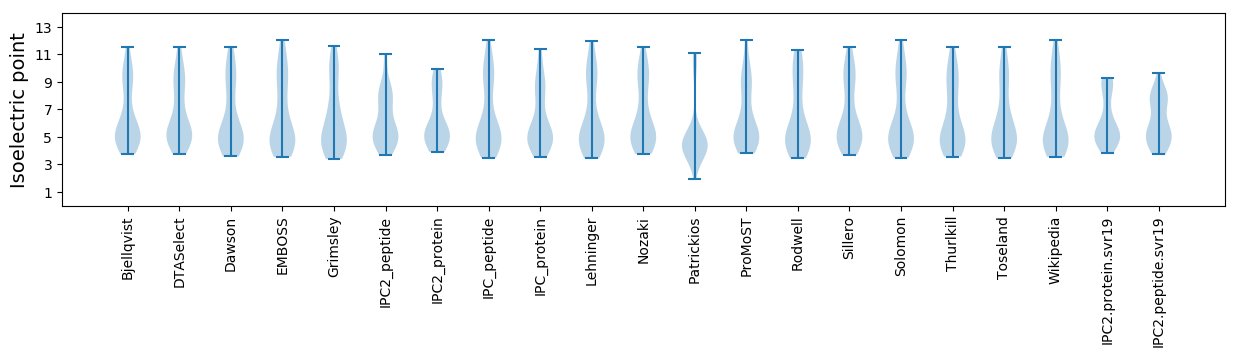
* You can choose from 21 different methods for calculating isoelectric point
Summary statistics related to proteome-wise predictions

Protein with the lowest isoelectric point:
>tr|A0A2P1CIC9|A0A2P1CIC9_9CAUD Tape measure protein OS=Actinomyces phage xhp1 OX=2099653 GN=XHP1_00017 PE=3 SV=1
MM1 pKa = 7.0SAVVAVTIGLVLAVAAIPVIVCVVYY26 pKa = 8.82LTGIYY31 pKa = 10.41AGDD34 pKa = 3.63ALDD37 pKa = 4.93RR38 pKa = 11.84LVCMGLDD45 pKa = 3.27AGDD48 pKa = 5.27RR49 pKa = 11.84IAEE52 pKa = 4.41MIDD55 pKa = 3.49GEE57 pKa = 4.83VPGKK61 pKa = 10.46
MM1 pKa = 7.0SAVVAVTIGLVLAVAAIPVIVCVVYY26 pKa = 8.82LTGIYY31 pKa = 10.41AGDD34 pKa = 3.63ALDD37 pKa = 4.93RR38 pKa = 11.84LVCMGLDD45 pKa = 3.27AGDD48 pKa = 5.27RR49 pKa = 11.84IAEE52 pKa = 4.41MIDD55 pKa = 3.49GEE57 pKa = 4.83VPGKK61 pKa = 10.46
Molecular weight: 6.19 kDa
Isoelectric point according different methods:
Protein with the highest isoelectric point:
>tr|A0A2P1CIF4|A0A2P1CIF4_9CAUD Uncharacterized protein OS=Actinomyces phage xhp1 OX=2099653 GN=XHP1_00025 PE=4 SV=1
MM1 pKa = 7.66PKK3 pKa = 10.07KK4 pKa = 10.26PPLDD8 pKa = 3.7VEE10 pKa = 3.96ITRR13 pKa = 11.84AIARR17 pKa = 11.84AHH19 pKa = 6.01ILYY22 pKa = 10.42ANRR25 pKa = 11.84PHH27 pKa = 7.78IDD29 pKa = 3.32EE30 pKa = 4.38RR31 pKa = 11.84VHH33 pKa = 7.49RR34 pKa = 11.84LVTEE38 pKa = 4.42ACARR42 pKa = 11.84AAHH45 pKa = 6.0YY46 pKa = 9.36PVEE49 pKa = 4.47VKK51 pKa = 10.57PSRR54 pKa = 11.84SALAPMRR61 pKa = 11.84PRR63 pKa = 11.84RR64 pKa = 11.84SAA66 pKa = 2.91
MM1 pKa = 7.66PKK3 pKa = 10.07KK4 pKa = 10.26PPLDD8 pKa = 3.7VEE10 pKa = 3.96ITRR13 pKa = 11.84AIARR17 pKa = 11.84AHH19 pKa = 6.01ILYY22 pKa = 10.42ANRR25 pKa = 11.84PHH27 pKa = 7.78IDD29 pKa = 3.32EE30 pKa = 4.38RR31 pKa = 11.84VHH33 pKa = 7.49RR34 pKa = 11.84LVTEE38 pKa = 4.42ACARR42 pKa = 11.84AAHH45 pKa = 6.0YY46 pKa = 9.36PVEE49 pKa = 4.47VKK51 pKa = 10.57PSRR54 pKa = 11.84SALAPMRR61 pKa = 11.84PRR63 pKa = 11.84RR64 pKa = 11.84SAA66 pKa = 2.91
Molecular weight: 7.49 kDa
Isoelectric point according different methods:
Peptides (in silico digests for buttom-up proteomics)
Below you can find in silico digests of the whole proteome with Trypsin, Chymotrypsin, Trypsin+LysC, LysN, ArgC proteases suitable for different mass spec machines.| Try ESI |
 |
|---|
| ChTry ESI |
|
|---|
| ArgC ESI |
|
|---|
| LysN ESI |
|
|---|
| TryLysC ESI |
|
|---|
| Try MALDI |
|
|---|
| ChTry MALDI |
|
|---|
| ArgC MALDI |
|
|---|
| LysN MALDI |
|
|---|
| TryLysC MALDI |
|
|---|
| Try LTQ |
|
|---|
| ChTry LTQ |
|
|---|
| ArgC LTQ |
|
|---|
| LysN LTQ |
|
|---|
| TryLysC LTQ |
|
|---|
| Try MSlow |
|
|---|
| ChTry MSlow |
|
|---|
| ArgC MSlow |
|
|---|
| LysN MSlow |
|
|---|
| TryLysC MSlow |
|
|---|
| Try MShigh |
|
|---|
| ChTry MShigh |
|
|---|
| ArgC MShigh |
|
|---|
| LysN MShigh |
|
|---|
| TryLysC MShigh |
|
|---|
General Statistics
Number of major isoforms |
Number of additional isoforms |
Number of all proteins |
Number of amino acids |
Min. Seq. Length |
Max. Seq. Length |
Avg. Seq. Length |
Avg. Mol. Weight |
|---|---|---|---|---|---|---|---|
0 |
10860 |
33 |
1229 |
201.1 |
21.75 |
Amino acid frequency
Ala |
Cys |
Asp |
Glu |
Phe |
Gly |
His |
Ile |
Lys |
Leu |
|---|---|---|---|---|---|---|---|---|---|
12.744 ± 0.47 | 0.875 ± 0.146 |
5.939 ± 0.252 | 6.197 ± 0.365 |
2.422 ± 0.24 | 8.49 ± 0.493 |
1.63 ± 0.188 | 4.273 ± 0.266 |
3.702 ± 0.26 | 8.223 ± 0.286 |
Met |
Asn |
Gln |
Pro |
Arg |
Ser |
Thr |
Val |
Trp |
Tyr |
|---|---|---|---|---|---|---|---|---|---|
1.952 ± 0.113 | 2.044 ± 0.211 |
5.82 ± 0.336 | 3.702 ± 0.154 |
6.998 ± 0.553 | 5.792 ± 0.3 |
7.265 ± 0.464 | 7.532 ± 0.34 |
2.164 ± 0.177 | 2.238 ± 0.131 |
Most of the basic statistics you can see at this page can be downloaded from this CSV file
See this proteome in:

Proteome-pI is available under Creative Commons Attribution-NoDerivs license, for more details see here
| Reference: Kozlowski LP. Proteome-pI 2.0: Proteome Isoelectric Point Database Update. Nucleic Acids Res. 2021, doi: 10.1093/nar/gkab944 | Contact: Lukasz P. Kozlowski |