Erythrobacter insulae
Taxonomy: cellular organisms; Bacteria; Proteobacteria; Alphaproteobacteria; Sphingomonadales; Erythrobacteraceae; Erythrobacter/Porphyrobacter group; Erythrobacter
Average proteome isoelectric point is 5.87
Get precalculated fractions of proteins
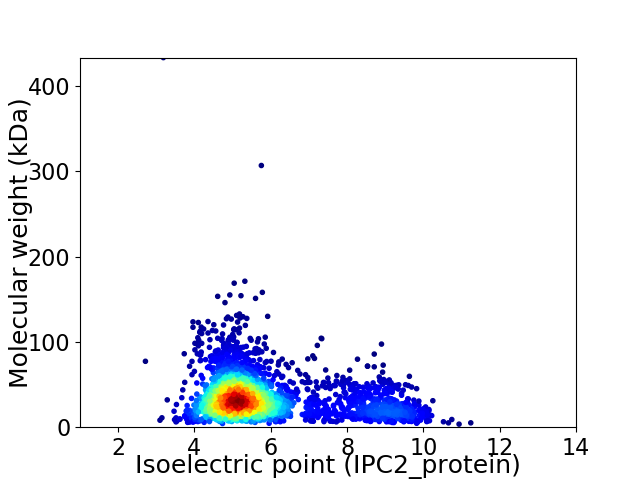
Virtual 2D-PAGE plot for 2737 proteins (isoelectric point calculated using IPC2_protein)
Get csv file with sequences according to given criteria:
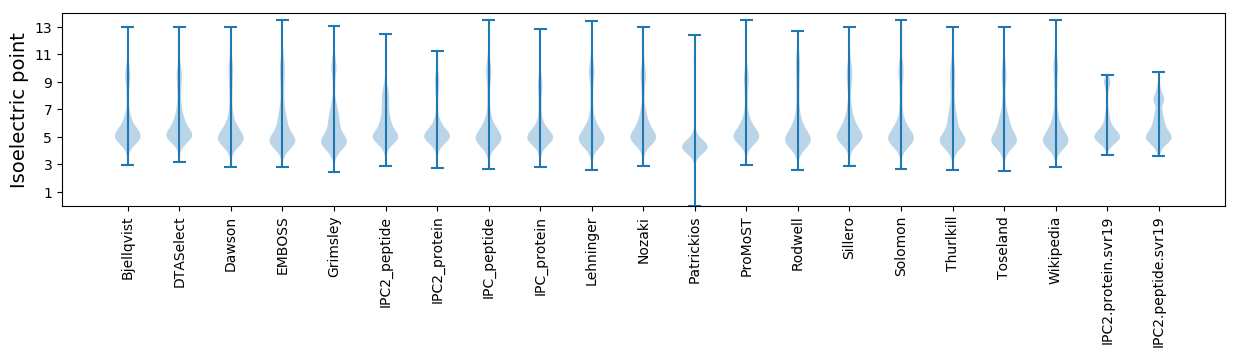
* You can choose from 21 different methods for calculating isoelectric point
Summary statistics related to proteome-wise predictions
Protein with the lowest isoelectric point:
>tr|A0A547PCW0|A0A547PCW0_9SPHN Acyl-CoA dehydrogenase OS=Erythrobacter insulae OX=2584124 GN=FGU71_08465 PE=3 SV=1
MM1 pKa = 7.11QRR3 pKa = 11.84MSHH6 pKa = 6.44ISWNSIGRR14 pKa = 11.84VGKK17 pKa = 7.63TAAMAAALGATSVCFADD34 pKa = 4.03EE35 pKa = 4.19AAAQTTTFTTQSVPDD50 pKa = 3.43TWTAVYY56 pKa = 10.83ADD58 pKa = 3.64ADD60 pKa = 3.67GRR62 pKa = 11.84TITVTMQPRR71 pKa = 11.84DD72 pKa = 3.77GSCAAINALGTIGSYY87 pKa = 8.85ATSSVAACDD96 pKa = 3.06RR97 pKa = 11.84AIRR100 pKa = 11.84ITYY103 pKa = 6.44VTSGFLVQEE112 pKa = 3.79IRR114 pKa = 11.84INDD117 pKa = 3.79IDD119 pKa = 5.26DD120 pKa = 3.61MDD122 pKa = 4.06GTGPRR127 pKa = 11.84DD128 pKa = 3.54GVAMTVPGTWSSSTIEE144 pKa = 4.06VHH146 pKa = 6.89SFAAPPLFANQAARR160 pKa = 11.84LTAAGGVGTFIANAAGDD177 pKa = 3.95NPVNEE182 pKa = 4.35AATFTMAAPTNTFTMLHH199 pKa = 7.31DD200 pKa = 4.54DD201 pKa = 3.93VQDD204 pKa = 3.74GRR206 pKa = 11.84DD207 pKa = 3.23ALFNFDD213 pKa = 4.72LNGMTITTAEE223 pKa = 4.2GNILTVDD230 pKa = 3.75DD231 pKa = 4.66SGSIASTTGGTNVLNVYY248 pKa = 10.64DD249 pKa = 4.87GDD251 pKa = 4.11TLNGVAAAPINTDD264 pKa = 2.71VSLVSGTTLQQGITFDD280 pKa = 3.52AATGEE285 pKa = 4.35VSVAAGTPVGEE296 pKa = 3.98YY297 pKa = 10.5SFDD300 pKa = 3.79YY301 pKa = 10.01EE302 pKa = 3.82ICEE305 pKa = 3.96VGFAANCEE313 pKa = 4.31TGTATVTVTGNVDD326 pKa = 3.85LDD328 pKa = 3.48ITKK331 pKa = 10.13TNTPGVNGEE340 pKa = 4.0IDD342 pKa = 3.34QATDD346 pKa = 3.13TVLAGSNTTYY356 pKa = 10.65TVIVTNNGPNPVNGAVVSDD375 pKa = 4.05TPGSGITCDD384 pKa = 3.23GATPITLTGSGVPAGSYY401 pKa = 9.19TFADD405 pKa = 3.17ISGVGISLEE414 pKa = 4.21TLSTGQSTTLSYY426 pKa = 11.02SCQVNN431 pKa = 3.11
MM1 pKa = 7.11QRR3 pKa = 11.84MSHH6 pKa = 6.44ISWNSIGRR14 pKa = 11.84VGKK17 pKa = 7.63TAAMAAALGATSVCFADD34 pKa = 4.03EE35 pKa = 4.19AAAQTTTFTTQSVPDD50 pKa = 3.43TWTAVYY56 pKa = 10.83ADD58 pKa = 3.64ADD60 pKa = 3.67GRR62 pKa = 11.84TITVTMQPRR71 pKa = 11.84DD72 pKa = 3.77GSCAAINALGTIGSYY87 pKa = 8.85ATSSVAACDD96 pKa = 3.06RR97 pKa = 11.84AIRR100 pKa = 11.84ITYY103 pKa = 6.44VTSGFLVQEE112 pKa = 3.79IRR114 pKa = 11.84INDD117 pKa = 3.79IDD119 pKa = 5.26DD120 pKa = 3.61MDD122 pKa = 4.06GTGPRR127 pKa = 11.84DD128 pKa = 3.54GVAMTVPGTWSSSTIEE144 pKa = 4.06VHH146 pKa = 6.89SFAAPPLFANQAARR160 pKa = 11.84LTAAGGVGTFIANAAGDD177 pKa = 3.95NPVNEE182 pKa = 4.35AATFTMAAPTNTFTMLHH199 pKa = 7.31DD200 pKa = 4.54DD201 pKa = 3.93VQDD204 pKa = 3.74GRR206 pKa = 11.84DD207 pKa = 3.23ALFNFDD213 pKa = 4.72LNGMTITTAEE223 pKa = 4.2GNILTVDD230 pKa = 3.75DD231 pKa = 4.66SGSIASTTGGTNVLNVYY248 pKa = 10.64DD249 pKa = 4.87GDD251 pKa = 4.11TLNGVAAAPINTDD264 pKa = 2.71VSLVSGTTLQQGITFDD280 pKa = 3.52AATGEE285 pKa = 4.35VSVAAGTPVGEE296 pKa = 3.98YY297 pKa = 10.5SFDD300 pKa = 3.79YY301 pKa = 10.01EE302 pKa = 3.82ICEE305 pKa = 3.96VGFAANCEE313 pKa = 4.31TGTATVTVTGNVDD326 pKa = 3.85LDD328 pKa = 3.48ITKK331 pKa = 10.13TNTPGVNGEE340 pKa = 4.0IDD342 pKa = 3.34QATDD346 pKa = 3.13TVLAGSNTTYY356 pKa = 10.65TVIVTNNGPNPVNGAVVSDD375 pKa = 4.05TPGSGITCDD384 pKa = 3.23GATPITLTGSGVPAGSYY401 pKa = 9.19TFADD405 pKa = 3.17ISGVGISLEE414 pKa = 4.21TLSTGQSTTLSYY426 pKa = 11.02SCQVNN431 pKa = 3.11
Molecular weight: 43.77 kDa
Isoelectric point according different methods:
Protein with the highest isoelectric point:
>tr|A0A547PCG5|A0A547PCG5_9SPHN Beta-galactosidase OS=Erythrobacter insulae OX=2584124 GN=FGU71_08070 PE=3 SV=1
MM1 pKa = 7.45KK2 pKa = 9.61RR3 pKa = 11.84TFQPSNLVRR12 pKa = 11.84ARR14 pKa = 11.84RR15 pKa = 11.84HH16 pKa = 4.89GFFARR21 pKa = 11.84KK22 pKa = 7.42ATPGGRR28 pKa = 11.84KK29 pKa = 9.21VIRR32 pKa = 11.84ARR34 pKa = 11.84RR35 pKa = 11.84KK36 pKa = 8.98RR37 pKa = 11.84GRR39 pKa = 11.84KK40 pKa = 9.08SLSAA44 pKa = 3.93
MM1 pKa = 7.45KK2 pKa = 9.61RR3 pKa = 11.84TFQPSNLVRR12 pKa = 11.84ARR14 pKa = 11.84RR15 pKa = 11.84HH16 pKa = 4.89GFFARR21 pKa = 11.84KK22 pKa = 7.42ATPGGRR28 pKa = 11.84KK29 pKa = 9.21VIRR32 pKa = 11.84ARR34 pKa = 11.84RR35 pKa = 11.84KK36 pKa = 8.98RR37 pKa = 11.84GRR39 pKa = 11.84KK40 pKa = 9.08SLSAA44 pKa = 3.93
Molecular weight: 5.11 kDa
Isoelectric point according different methods:
Peptides (in silico digests for buttom-up proteomics)
Below you can find in silico digests of the whole proteome with Trypsin, Chymotrypsin, Trypsin+LysC, LysN, ArgC proteases suitable for different mass spec machines.| Try ESI |
 |
|---|
| ChTry ESI |
|
|---|
| ArgC ESI |
|
|---|
| LysN ESI |
|
|---|
| TryLysC ESI |
|
|---|
| Try MALDI |
|
|---|
| ChTry MALDI |
|
|---|
| ArgC MALDI |
|
|---|
| LysN MALDI |
|
|---|
| TryLysC MALDI |
|
|---|
| Try LTQ |
|
|---|
| ChTry LTQ |
|
|---|
| ArgC LTQ |
|
|---|
| LysN LTQ |
|
|---|
| TryLysC LTQ |
|
|---|
| Try MSlow |
|
|---|
| ChTry MSlow |
|
|---|
| ArgC MSlow |
|
|---|
| LysN MSlow |
|
|---|
| TryLysC MSlow |
|
|---|
| Try MShigh |
|
|---|
| ChTry MShigh |
|
|---|
| ArgC MShigh |
|
|---|
| LysN MShigh |
|
|---|
| TryLysC MShigh |
|
|---|
General Statistics
Number of major isoforms |
Number of additional isoforms |
Number of all proteins |
Number of amino acids |
Min. Seq. Length |
Max. Seq. Length |
Avg. Seq. Length |
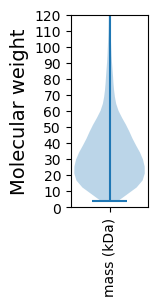
Avg. Mol. Weight |
|---|---|---|---|---|---|---|---|
0 |
904613 |
30 |
4491 |
330.5 |
35.84 |
Amino acid frequency
Ala |
Cys |
Asp |
Glu |
Phe |
Gly |
His |
Ile |
Lys |
Leu |
|---|---|---|---|---|---|---|---|---|---|
12.173 ± 0.062 | 0.792 ± 0.016 |
6.259 ± 0.039 | 6.203 ± 0.046 |
3.843 ± 0.038 | 8.747 ± 0.049 |
1.873 ± 0.024 | 5.583 ± 0.035 |
3.503 ± 0.04 | 9.427 ± 0.045 |
Met |
Asn |
Gln |
Pro |
Arg |
Ser |
Thr |
Val |
Trp |
Tyr |
|---|---|---|---|---|---|---|---|---|---|
2.545 ± 0.026 | 2.993 ± 0.033 |
4.976 ± 0.031 | 3.284 ± 0.025 |
6.361 ± 0.044 | 5.793 ± 0.036 |
5.319 ± 0.033 | 6.747 ± 0.033 |
1.379 ± 0.02 | 2.198 ± 0.024 |
Most of the basic statistics you can see at this page can be downloaded from this CSV file
See this proteome in:

Proteome-pI is available under Creative Commons Attribution-NoDerivs license, for more details see here
| Reference: Kozlowski LP. Proteome-pI 2.0: Proteome Isoelectric Point Database Update. Nucleic Acids Res. 2021, doi: 10.1093/nar/gkab944 | Contact: Lukasz P. Kozlowski |