Waterbuck coronavirus US/OH-WD358/1994
Taxonomy: Viruses; Riboviria; Orthornavirae; Pisuviricota; Pisoniviricetes; Nidovirales; Cornidovirineae; Coronaviridae; Orthocoronavirinae; Betacoronavirus; Embecovirus; Betacoronavirus 1; Bovine coronavirus
Average proteome isoelectric point is 6.0
Get precalculated fractions of proteins
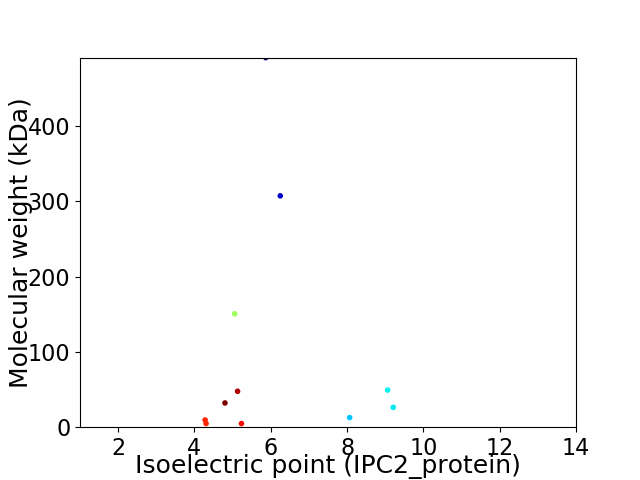
Virtual 2D-PAGE plot for 11 proteins (isoelectric point calculated using IPC2_protein)
Get csv file with sequences according to given criteria:
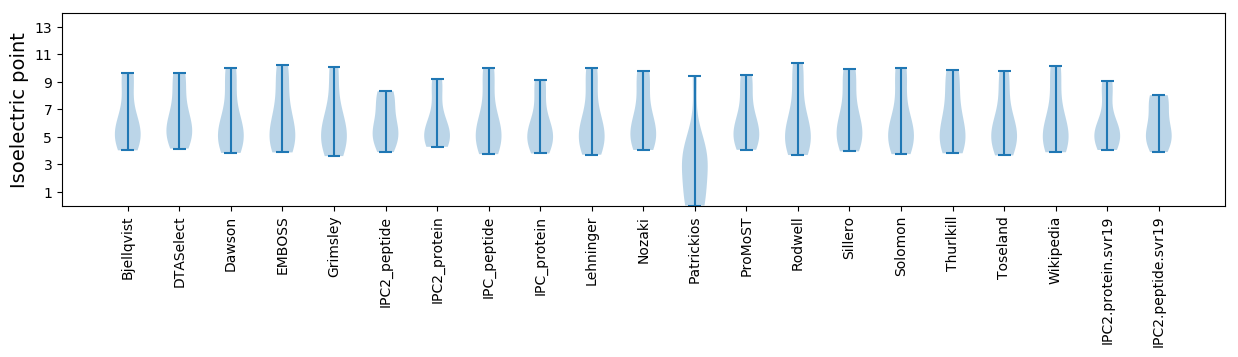
* You can choose from 21 different methods for calculating isoelectric point
Summary statistics related to proteome-wise predictions
Protein with the lowest isoelectric point:
>tr|B7U2N6|B7U2N6_9BETC 12.7 kDa non-structural protein OS=Waterbuck coronavirus US/OH-WD358/1994 OX=422135 PE=4 SV=1
MM1 pKa = 7.63PMATTIEE8 pKa = 4.31GADD11 pKa = 3.74YY12 pKa = 10.42TNIMPITVLTTVYY25 pKa = 10.14LGVSIGIDD33 pKa = 3.08TSTTGFTCFSRR44 pKa = 11.84YY45 pKa = 8.24
MM1 pKa = 7.63PMATTIEE8 pKa = 4.31GADD11 pKa = 3.74YY12 pKa = 10.42TNIMPITVLTTVYY25 pKa = 10.14LGVSIGIDD33 pKa = 3.08TSTTGFTCFSRR44 pKa = 11.84YY45 pKa = 8.24
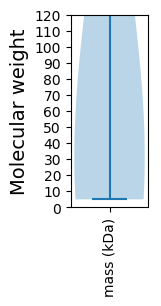
Molecular weight: 4.85 kDa
Isoelectric point according different methods:
Protein with the highest isoelectric point:
>tr|B7U2N9|B7U2N9_9BETC Nucleoprotein OS=Waterbuck coronavirus US/OH-WD358/1994 OX=422135 GN=N PE=3 SV=1
MM1 pKa = 7.55SFTPGKK7 pKa = 9.79QSSSRR12 pKa = 11.84ASSGNRR18 pKa = 11.84SGNGILKK25 pKa = 9.42WADD28 pKa = 3.13QSDD31 pKa = 3.63QSRR34 pKa = 11.84NVQTRR39 pKa = 11.84GRR41 pKa = 11.84RR42 pKa = 11.84AQPKK46 pKa = 7.96QTATSQQPPGGNVVPYY62 pKa = 8.75YY63 pKa = 10.8SWFSGITQFQKK74 pKa = 10.77GKK76 pKa = 9.42EE77 pKa = 3.95FEE79 pKa = 4.16FAEE82 pKa = 4.69GQGVPIAPGVPATEE96 pKa = 4.32AKK98 pKa = 10.35GYY100 pKa = 9.01WYY102 pKa = 10.34RR103 pKa = 11.84HH104 pKa = 4.43NRR106 pKa = 11.84RR107 pKa = 11.84SFKK110 pKa = 10.37TADD113 pKa = 3.13GNQRR117 pKa = 11.84QLLPRR122 pKa = 11.84WYY124 pKa = 9.8FYY126 pKa = 11.56YY127 pKa = 10.78LGTGPHH133 pKa = 6.97AKK135 pKa = 9.91DD136 pKa = 3.92QYY138 pKa = 10.35GTDD141 pKa = 3.18IDD143 pKa = 4.14GVFWVASNQADD154 pKa = 3.74VNTPADD160 pKa = 3.51ILDD163 pKa = 4.5RR164 pKa = 11.84DD165 pKa = 3.95PSSDD169 pKa = 3.15EE170 pKa = 4.8AIPTRR175 pKa = 11.84FPPGTVLPQGYY186 pKa = 9.38YY187 pKa = 9.56IEE189 pKa = 4.86GSGRR193 pKa = 11.84SAPNSRR199 pKa = 11.84STSRR203 pKa = 11.84ASSRR207 pKa = 11.84ASSAGSRR214 pKa = 11.84SRR216 pKa = 11.84ANSGNRR222 pKa = 11.84TPTSGVTPDD231 pKa = 3.68MADD234 pKa = 3.28QIASLVLAKK243 pKa = 10.41LGKK246 pKa = 10.07DD247 pKa = 2.95ATKK250 pKa = 9.49PQQVTKK256 pKa = 9.39QTAKK260 pKa = 10.6EE261 pKa = 3.73IRR263 pKa = 11.84QKK265 pKa = 10.67ILNKK269 pKa = 9.31PRR271 pKa = 11.84QKK273 pKa = 10.46RR274 pKa = 11.84SPNKK278 pKa = 9.02QCTVQQCFGKK288 pKa = 10.48RR289 pKa = 11.84GPNQNFGGGEE299 pKa = 3.99MLKK302 pKa = 10.67LGTSDD307 pKa = 3.38PQFPILAEE315 pKa = 4.05LAPTAGAFFFGSRR328 pKa = 11.84LEE330 pKa = 4.03LAKK333 pKa = 10.7VQNLSGNLDD342 pKa = 3.59EE343 pKa = 4.91PQKK346 pKa = 10.98DD347 pKa = 4.13VYY349 pKa = 9.8EE350 pKa = 3.97LRR352 pKa = 11.84YY353 pKa = 10.38NGAIRR358 pKa = 11.84FDD360 pKa = 3.73STLSGFEE367 pKa = 4.32TIMKK371 pKa = 9.51VLNEE375 pKa = 4.23NLNAYY380 pKa = 7.19QQQDD384 pKa = 2.72GMMNMSPKK392 pKa = 9.54PQRR395 pKa = 11.84QRR397 pKa = 11.84GQKK400 pKa = 9.76NGQGEE405 pKa = 4.35NDD407 pKa = 4.27NISVAAPKK415 pKa = 10.67SRR417 pKa = 11.84VQQNKK422 pKa = 9.07SRR424 pKa = 11.84EE425 pKa = 4.15LTAEE429 pKa = 4.92DD430 pKa = 3.26ISLLKK435 pKa = 11.03KK436 pKa = 9.46MDD438 pKa = 3.65EE439 pKa = 4.58PFTEE443 pKa = 4.44DD444 pKa = 2.7TSEE447 pKa = 3.72II448 pKa = 3.93
MM1 pKa = 7.55SFTPGKK7 pKa = 9.79QSSSRR12 pKa = 11.84ASSGNRR18 pKa = 11.84SGNGILKK25 pKa = 9.42WADD28 pKa = 3.13QSDD31 pKa = 3.63QSRR34 pKa = 11.84NVQTRR39 pKa = 11.84GRR41 pKa = 11.84RR42 pKa = 11.84AQPKK46 pKa = 7.96QTATSQQPPGGNVVPYY62 pKa = 8.75YY63 pKa = 10.8SWFSGITQFQKK74 pKa = 10.77GKK76 pKa = 9.42EE77 pKa = 3.95FEE79 pKa = 4.16FAEE82 pKa = 4.69GQGVPIAPGVPATEE96 pKa = 4.32AKK98 pKa = 10.35GYY100 pKa = 9.01WYY102 pKa = 10.34RR103 pKa = 11.84HH104 pKa = 4.43NRR106 pKa = 11.84RR107 pKa = 11.84SFKK110 pKa = 10.37TADD113 pKa = 3.13GNQRR117 pKa = 11.84QLLPRR122 pKa = 11.84WYY124 pKa = 9.8FYY126 pKa = 11.56YY127 pKa = 10.78LGTGPHH133 pKa = 6.97AKK135 pKa = 9.91DD136 pKa = 3.92QYY138 pKa = 10.35GTDD141 pKa = 3.18IDD143 pKa = 4.14GVFWVASNQADD154 pKa = 3.74VNTPADD160 pKa = 3.51ILDD163 pKa = 4.5RR164 pKa = 11.84DD165 pKa = 3.95PSSDD169 pKa = 3.15EE170 pKa = 4.8AIPTRR175 pKa = 11.84FPPGTVLPQGYY186 pKa = 9.38YY187 pKa = 9.56IEE189 pKa = 4.86GSGRR193 pKa = 11.84SAPNSRR199 pKa = 11.84STSRR203 pKa = 11.84ASSRR207 pKa = 11.84ASSAGSRR214 pKa = 11.84SRR216 pKa = 11.84ANSGNRR222 pKa = 11.84TPTSGVTPDD231 pKa = 3.68MADD234 pKa = 3.28QIASLVLAKK243 pKa = 10.41LGKK246 pKa = 10.07DD247 pKa = 2.95ATKK250 pKa = 9.49PQQVTKK256 pKa = 9.39QTAKK260 pKa = 10.6EE261 pKa = 3.73IRR263 pKa = 11.84QKK265 pKa = 10.67ILNKK269 pKa = 9.31PRR271 pKa = 11.84QKK273 pKa = 10.46RR274 pKa = 11.84SPNKK278 pKa = 9.02QCTVQQCFGKK288 pKa = 10.48RR289 pKa = 11.84GPNQNFGGGEE299 pKa = 3.99MLKK302 pKa = 10.67LGTSDD307 pKa = 3.38PQFPILAEE315 pKa = 4.05LAPTAGAFFFGSRR328 pKa = 11.84LEE330 pKa = 4.03LAKK333 pKa = 10.7VQNLSGNLDD342 pKa = 3.59EE343 pKa = 4.91PQKK346 pKa = 10.98DD347 pKa = 4.13VYY349 pKa = 9.8EE350 pKa = 3.97LRR352 pKa = 11.84YY353 pKa = 10.38NGAIRR358 pKa = 11.84FDD360 pKa = 3.73STLSGFEE367 pKa = 4.32TIMKK371 pKa = 9.51VLNEE375 pKa = 4.23NLNAYY380 pKa = 7.19QQQDD384 pKa = 2.72GMMNMSPKK392 pKa = 9.54PQRR395 pKa = 11.84QRR397 pKa = 11.84GQKK400 pKa = 9.76NGQGEE405 pKa = 4.35NDD407 pKa = 4.27NISVAAPKK415 pKa = 10.67SRR417 pKa = 11.84VQQNKK422 pKa = 9.07SRR424 pKa = 11.84EE425 pKa = 4.15LTAEE429 pKa = 4.92DD430 pKa = 3.26ISLLKK435 pKa = 11.03KK436 pKa = 9.46MDD438 pKa = 3.65EE439 pKa = 4.58PFTEE443 pKa = 4.44DD444 pKa = 2.7TSEE447 pKa = 3.72II448 pKa = 3.93
Molecular weight: 49.32 kDa
Isoelectric point according different methods:
Peptides (in silico digests for buttom-up proteomics)
Below you can find in silico digests of the whole proteome with Trypsin, Chymotrypsin, Trypsin+LysC, LysN, ArgC proteases suitable for different mass spec machines.| Try ESI |
 |
|---|
| ChTry ESI |
|
|---|
| ArgC ESI |
|
|---|
| LysN ESI |
|
|---|
| TryLysC ESI |
|
|---|
| Try MALDI |
|
|---|
| ChTry MALDI |
|
|---|
| ArgC MALDI |
|
|---|
| LysN MALDI |
|
|---|
| TryLysC MALDI |
|
|---|
| Try LTQ |
|
|---|
| ChTry LTQ |
|
|---|
| ArgC LTQ |
|
|---|
| LysN LTQ |
|
|---|
| TryLysC LTQ |
|
|---|
| Try MSlow |
|
|---|
| ChTry MSlow |
|
|---|
| ArgC MSlow |
|
|---|
| LysN MSlow |
|
|---|
| TryLysC MSlow |
|
|---|
| Try MShigh |
|
|---|
| ChTry MShigh |
|
|---|
| ArgC MShigh |
|
|---|
| LysN MShigh |
|
|---|
| TryLysC MShigh |
|
|---|
General Statistics
Number of major isoforms |
Number of additional isoforms |
Number of all proteins |
Number of amino acids |
Min. Seq. Length |
Max. Seq. Length |
Avg. Seq. Length |
Avg. Mol. Weight |
|---|---|---|---|---|---|---|---|
0 |
10124 |
43 |
4383 |
920.4 |
103.29 |
Amino acid frequency
Ala |
Cys |
Asp |
Glu |
Phe |
Gly |
His |
Ile |
Lys |
Leu |
|---|---|---|---|---|---|---|---|---|---|
6.341 ± 0.245 | 3.467 ± 0.344 |
6.114 ± 0.27 | 3.645 ± 0.252 |
5.541 ± 0.19 | 6.025 ± 0.375 |
1.64 ± 0.189 | 5.383 ± 0.377 |
5.759 ± 0.525 | 8.919 ± 0.398 |
Met |
Asn |
Gln |
Pro |
Arg |
Ser |
Thr |
Val |
Trp |
Tyr |
|---|---|---|---|---|---|---|---|---|---|
2.203 ± 0.188 | 5.561 ± 0.657 |
3.516 ± 0.481 | 3.526 ± 0.384 |
3.378 ± 0.36 | 7.141 ± 0.304 |
5.966 ± 0.434 | 9.226 ± 0.923 |
1.254 ± 0.094 | 5.393 ± 0.373 |
Most of the basic statistics you can see at this page can be downloaded from this CSV file
See this proteome in:

Proteome-pI is available under Creative Commons Attribution-NoDerivs license, for more details see here
| Reference: Kozlowski LP. Proteome-pI 2.0: Proteome Isoelectric Point Database Update. Nucleic Acids Res. 2021, doi: 10.1093/nar/gkab944 | Contact: Lukasz P. Kozlowski |