Rat coronavirus Parker
Taxonomy: Viruses; Riboviria; Orthornavirae; Pisuviricota; Pisoniviricetes; Nidovirales; Cornidovirineae; Coronaviridae; Orthocoronavirinae; Betacoronavirus; Embecovirus; Murine coronavirus; Rat coronavirus
Average proteome isoelectric point is 6.91
Get precalculated fractions of proteins
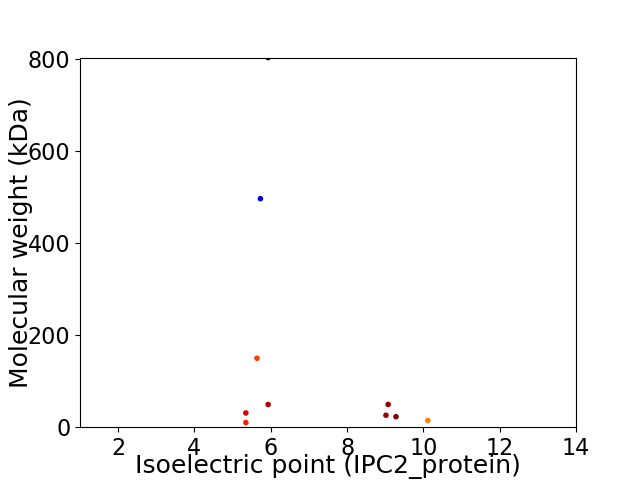
Virtual 2D-PAGE plot for 10 proteins (isoelectric point calculated using IPC2_protein)
Get csv file with sequences according to given criteria:
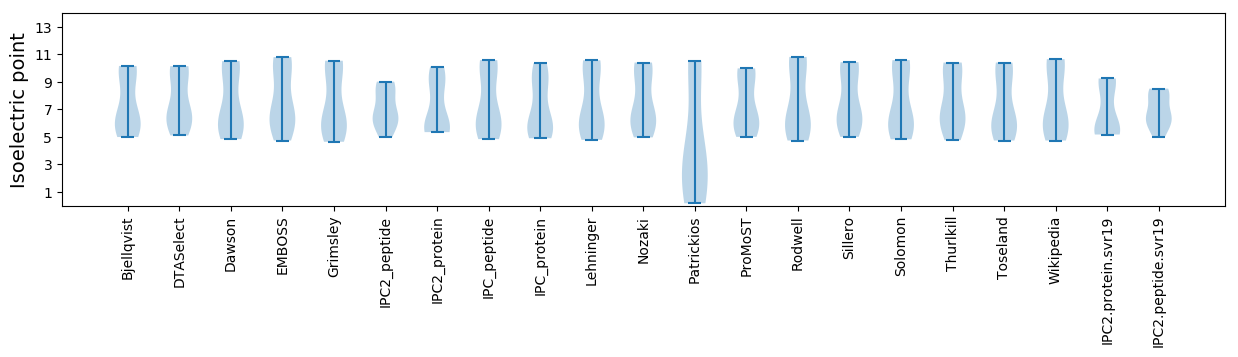
* You can choose from 21 different methods for calculating isoelectric point
Summary statistics related to proteome-wise predictions
Protein with the lowest isoelectric point:
>tr|C6GHS1|C6GHS1_9BETC Hemagglutinin-esterase OS=Rat coronavirus Parker OX=502102 GN=HE PE=3 SV=1
MM1 pKa = 6.88AAKK4 pKa = 9.16MAFADD9 pKa = 4.45KK10 pKa = 10.16PNHH13 pKa = 6.87FINFPLAQFSGFMGKK28 pKa = 8.01YY29 pKa = 10.17LKK31 pKa = 10.62LQSQLVEE38 pKa = 4.08MGLDD42 pKa = 3.76CKK44 pKa = 10.5LQKK47 pKa = 10.45APHH50 pKa = 5.8VSITMLDD57 pKa = 3.36IKK59 pKa = 10.77ADD61 pKa = 3.4QYY63 pKa = 11.35KK64 pKa = 9.6QVEE67 pKa = 4.22FAIQEE72 pKa = 4.16ILDD75 pKa = 4.04DD76 pKa = 3.96LAAYY80 pKa = 9.04EE81 pKa = 4.65GYY83 pKa = 9.96IVFDD87 pKa = 3.86NPHH90 pKa = 5.55MLGRR94 pKa = 11.84CLVLDD99 pKa = 3.42VKK101 pKa = 10.92GFEE104 pKa = 4.26EE105 pKa = 4.24LHH107 pKa = 6.8VDD109 pKa = 2.8IVEE112 pKa = 4.28ILRR115 pKa = 11.84KK116 pKa = 8.86MGCTADD122 pKa = 3.85QSRR125 pKa = 11.84VWIPHH130 pKa = 4.93CTVAQFEE137 pKa = 4.42EE138 pKa = 4.53EE139 pKa = 4.22KK140 pKa = 10.44EE141 pKa = 3.96INAMQFYY148 pKa = 10.13YY149 pKa = 10.98KK150 pKa = 10.69LPFYY154 pKa = 10.68LKK156 pKa = 10.34HH157 pKa = 6.41NNILTDD163 pKa = 3.28SRR165 pKa = 11.84LEE167 pKa = 3.86LVKK170 pKa = 10.59IGSSKK175 pKa = 10.27IDD177 pKa = 3.21GFYY180 pKa = 10.77CSEE183 pKa = 3.98LSVWCGEE190 pKa = 4.13RR191 pKa = 11.84LCYY194 pKa = 10.09KK195 pKa = 10.34PPTPKK200 pKa = 10.32FSDD203 pKa = 2.77IFGYY207 pKa = 10.61CCIEE211 pKa = 4.62KK212 pKa = 10.19IRR214 pKa = 11.84GDD216 pKa = 4.11LEE218 pKa = 5.67IGDD221 pKa = 4.82LPQDD225 pKa = 4.71DD226 pKa = 4.12EE227 pKa = 4.54EE228 pKa = 5.09AWAEE232 pKa = 3.96LSYY235 pKa = 10.57HH236 pKa = 4.98YY237 pKa = 10.55QRR239 pKa = 11.84NTYY242 pKa = 8.74FFRR245 pKa = 11.84YY246 pKa = 9.06VHH248 pKa = 7.01DD249 pKa = 3.58NSIYY253 pKa = 9.87FRR255 pKa = 11.84IVCRR259 pKa = 11.84MKK261 pKa = 11.01GCMCC265 pKa = 5.37
MM1 pKa = 6.88AAKK4 pKa = 9.16MAFADD9 pKa = 4.45KK10 pKa = 10.16PNHH13 pKa = 6.87FINFPLAQFSGFMGKK28 pKa = 8.01YY29 pKa = 10.17LKK31 pKa = 10.62LQSQLVEE38 pKa = 4.08MGLDD42 pKa = 3.76CKK44 pKa = 10.5LQKK47 pKa = 10.45APHH50 pKa = 5.8VSITMLDD57 pKa = 3.36IKK59 pKa = 10.77ADD61 pKa = 3.4QYY63 pKa = 11.35KK64 pKa = 9.6QVEE67 pKa = 4.22FAIQEE72 pKa = 4.16ILDD75 pKa = 4.04DD76 pKa = 3.96LAAYY80 pKa = 9.04EE81 pKa = 4.65GYY83 pKa = 9.96IVFDD87 pKa = 3.86NPHH90 pKa = 5.55MLGRR94 pKa = 11.84CLVLDD99 pKa = 3.42VKK101 pKa = 10.92GFEE104 pKa = 4.26EE105 pKa = 4.24LHH107 pKa = 6.8VDD109 pKa = 2.8IVEE112 pKa = 4.28ILRR115 pKa = 11.84KK116 pKa = 8.86MGCTADD122 pKa = 3.85QSRR125 pKa = 11.84VWIPHH130 pKa = 4.93CTVAQFEE137 pKa = 4.42EE138 pKa = 4.53EE139 pKa = 4.22KK140 pKa = 10.44EE141 pKa = 3.96INAMQFYY148 pKa = 10.13YY149 pKa = 10.98KK150 pKa = 10.69LPFYY154 pKa = 10.68LKK156 pKa = 10.34HH157 pKa = 6.41NNILTDD163 pKa = 3.28SRR165 pKa = 11.84LEE167 pKa = 3.86LVKK170 pKa = 10.59IGSSKK175 pKa = 10.27IDD177 pKa = 3.21GFYY180 pKa = 10.77CSEE183 pKa = 3.98LSVWCGEE190 pKa = 4.13RR191 pKa = 11.84LCYY194 pKa = 10.09KK195 pKa = 10.34PPTPKK200 pKa = 10.32FSDD203 pKa = 2.77IFGYY207 pKa = 10.61CCIEE211 pKa = 4.62KK212 pKa = 10.19IRR214 pKa = 11.84GDD216 pKa = 4.11LEE218 pKa = 5.67IGDD221 pKa = 4.82LPQDD225 pKa = 4.71DD226 pKa = 4.12EE227 pKa = 4.54EE228 pKa = 5.09AWAEE232 pKa = 3.96LSYY235 pKa = 10.57HH236 pKa = 4.98YY237 pKa = 10.55QRR239 pKa = 11.84NTYY242 pKa = 8.74FFRR245 pKa = 11.84YY246 pKa = 9.06VHH248 pKa = 7.01DD249 pKa = 3.58NSIYY253 pKa = 9.87FRR255 pKa = 11.84IVCRR259 pKa = 11.84MKK261 pKa = 11.01GCMCC265 pKa = 5.37
Molecular weight: 30.89 kDa
Isoelectric point according different methods:
Protein with the highest isoelectric point:
>tr|C6GHS4|C6GHS4_9BETC Envelope small membrane protein OS=Rat coronavirus Parker OX=502102 GN=E PE=3 SV=1
MM1 pKa = 7.55AALGHH6 pKa = 6.11KK7 pKa = 10.08AKK9 pKa = 10.41LAAVFIGPFIVACMLGISLVYY30 pKa = 10.3LYY32 pKa = 10.3QLQVQIFHH40 pKa = 6.52VNNTIRR46 pKa = 11.84VTGKK50 pKa = 9.14PATVSYY56 pKa = 9.6TLSTPVTPVATTLDD70 pKa = 3.53GTTYY74 pKa = 10.5TLIRR78 pKa = 11.84PTSSYY83 pKa = 9.51TRR85 pKa = 11.84VYY87 pKa = 10.25LGKK90 pKa = 8.56TRR92 pKa = 11.84GFDD95 pKa = 3.03TSTFGPKK102 pKa = 9.26VLNYY106 pKa = 7.82ITSSKK111 pKa = 9.91PHH113 pKa = 6.34LNSGRR118 pKa = 11.84PYY120 pKa = 10.26TFRR123 pKa = 11.84HH124 pKa = 5.03MPKK127 pKa = 10.18YY128 pKa = 10.15MKK130 pKa = 10.78GLVV133 pKa = 3.3
MM1 pKa = 7.55AALGHH6 pKa = 6.11KK7 pKa = 10.08AKK9 pKa = 10.41LAAVFIGPFIVACMLGISLVYY30 pKa = 10.3LYY32 pKa = 10.3QLQVQIFHH40 pKa = 6.52VNNTIRR46 pKa = 11.84VTGKK50 pKa = 9.14PATVSYY56 pKa = 9.6TLSTPVTPVATTLDD70 pKa = 3.53GTTYY74 pKa = 10.5TLIRR78 pKa = 11.84PTSSYY83 pKa = 9.51TRR85 pKa = 11.84VYY87 pKa = 10.25LGKK90 pKa = 8.56TRR92 pKa = 11.84GFDD95 pKa = 3.03TSTFGPKK102 pKa = 9.26VLNYY106 pKa = 7.82ITSSKK111 pKa = 9.91PHH113 pKa = 6.34LNSGRR118 pKa = 11.84PYY120 pKa = 10.26TFRR123 pKa = 11.84HH124 pKa = 5.03MPKK127 pKa = 10.18YY128 pKa = 10.15MKK130 pKa = 10.78GLVV133 pKa = 3.3
Molecular weight: 14.65 kDa
Isoelectric point according different methods:
Peptides (in silico digests for buttom-up proteomics)
Below you can find in silico digests of the whole proteome with Trypsin, Chymotrypsin, Trypsin+LysC, LysN, ArgC proteases suitable for different mass spec machines.| Try ESI |
 |
|---|
| ChTry ESI |
|
|---|
| ArgC ESI |
|
|---|
| LysN ESI |
|
|---|
| TryLysC ESI |
|
|---|
| Try MALDI |
|
|---|
| ChTry MALDI |
|
|---|
| ArgC MALDI |
|
|---|
| LysN MALDI |
|
|---|
| TryLysC MALDI |
|
|---|
| Try LTQ |
|
|---|
| ChTry LTQ |
|
|---|
| ArgC LTQ |
|
|---|
| LysN LTQ |
|
|---|
| TryLysC LTQ |
|
|---|
| Try MSlow |
|
|---|
| ChTry MSlow |
|
|---|
| ArgC MSlow |
|
|---|
| LysN MSlow |
|
|---|
| TryLysC MSlow |
|
|---|
| Try MShigh |
|
|---|
| ChTry MShigh |
|
|---|
| ArgC MShigh |
|
|---|
| LysN MShigh |
|
|---|
| TryLysC MShigh |
|
|---|
General Statistics
Number of major isoforms |
Number of additional isoforms |
Number of all proteins |
Number of amino acids |
Min. Seq. Length |
Max. Seq. Length |
Avg. Seq. Length |
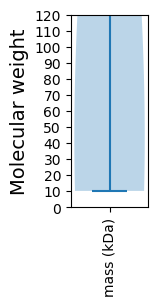
Avg. Mol. Weight |
|---|---|---|---|---|---|---|---|
0 |
14810 |
88 |
7172 |
1481.0 |
165.2 |
Amino acid frequency
Ala |
Cys |
Asp |
Glu |
Phe |
Gly |
His |
Ile |
Lys |
Leu |
|---|---|---|---|---|---|---|---|---|---|
6.853 ± 0.275 | 3.768 ± 0.333 |
5.692 ± 0.424 | 4.099 ± 0.245 |
5.213 ± 0.172 | 6.138 ± 0.47 |
1.749 ± 0.105 | 4.321 ± 0.472 |
5.719 ± 0.453 | 9.406 ± 0.372 |
Met |
Asn |
Gln |
Pro |
Arg |
Ser |
Thr |
Val |
Trp |
Tyr |
|---|---|---|---|---|---|---|---|---|---|
2.302 ± 0.178 | 4.875 ± 0.629 |
3.788 ± 0.437 | 3.376 ± 0.397 |
3.653 ± 0.29 | 7.245 ± 0.506 |
5.665 ± 0.213 | 10.095 ± 0.981 |
1.296 ± 0.079 | 4.747 ± 0.293 |
Most of the basic statistics you can see at this page can be downloaded from this CSV file
See this proteome in:

Proteome-pI is available under Creative Commons Attribution-NoDerivs license, for more details see here
| Reference: Kozlowski LP. Proteome-pI 2.0: Proteome Isoelectric Point Database Update. Nucleic Acids Res. 2021, doi: 10.1093/nar/gkab944 | Contact: Lukasz P. Kozlowski |